Assyrian/Chaldean/Syriac vs Immigrants from Fiji 12th Grade, No Diploma

COMPARE

Assyrian/Chaldean/Syriac
Race
Ancestry
AfghanAfricanAlaska NativeAlaskan AthabascanAlbanianAleutAlsatianAmericanApacheArabArapahoArgentineanArmenianAssyrian/Chaldean/SyriacAustralianAustrianBahamianBangladeshiBarbadianBasqueBelgianBelizeanBermudanBhutaneseBlackfeetBolivianBrazilianBritishBritish West IndianBulgarianBurmeseCajunCambodianCanadianCape VerdeanCarpatho RusynCelticCentral AmericanCentral American IndianCherokeeCheyenneChickasawChileanChineseChippewaChoctawColombianColvilleComancheCosta RicanCreeCreekCroatianCrowCubanCypriotCzechCzechoslovakianDanishDelawareDominicanDutchDutch West IndianEastern EuropeanEcuadorianEgyptianEnglishEstonianEthiopianEuropeanFijianFilipinoFinnishFrenchFrench American IndianFrench CanadianGermanGerman RussianGhanaianGreekGuamanian/ChamorroGuatemalanGuyaneseHaitianHmongHonduranHopiHoumaHungarianIcelanderIndian (Asian)IndonesianInupiatIranianIraqiIrishIroquoisIsraeliItalianJamaicanJapaneseJordanianKenyanKiowaKoreanLaotianLatvianLebaneseLiberianLithuanianLumbeeLuxembourgerMacedonianMalaysianMalteseMarshalleseMenomineeMexicanMexican American IndianMongolianMoroccanNative HawaiianNavajoNepaleseNew ZealanderNicaraguanNigerianNorthern EuropeanNorwegianOkinawanOsageOttawaPaiutePakistaniPalestinianPanamanianParaguayanPennsylvania GermanPeruvianPimaPolishPortuguesePotawatomiPuebloPuerto RicanPuget Sound SalishRomanianRussianSalvadoranSamoanScandinavianScotch-IrishScottishSeminoleSenegaleseSerbianShoshoneSierra LeoneanSiouxSlavicSlovakSloveneSomaliSouth AfricanSouth AmericanSouth American IndianSoviet UnionSpaniardSpanishSpanish AmericanSpanish American IndianSri LankanSubsaharan AfricanSudaneseSwedishSwissSyrianTaiwaneseThaiTlingit-HaidaTohono O'OdhamTonganTrinidadian and TobagonianTsimshianTurkishU.S. Virgin IslanderUgandanUkrainianUruguayanUteVenezuelanVietnameseWelshWest IndianYakamaYaquiYugoslavianYumanYup'ikZimbabwean
Immigration
NonimmigrantsImmigrantsAfghanistanAfricaAlbaniaArgentinaArmeniaAsiaAustraliaAustriaBahamasBangladeshBarbadosBelarusBelgiumBelizeBoliviaBosnia and HerzegovinaBrazilBulgariaBurma/MyanmarCabo VerdeCambodiaCameroonCanadaCaribbeanCentral AmericaChileChinaColombiaCongoCosta RicaCroatiaCubaCzechoslovakiaDenmarkDominicaDominican RepublicEastern AfricaEastern AsiaEastern EuropeEcuadorEgyptEl SalvadorEnglandEritreaEthiopiaEuropeFranceGermanyGhanaGreeceGrenadaGuatemalaGuyanaHaitiHondurasHong KongHungaryIndiaIndonesiaIranIraqIrelandIsraelItalyJamaicaJapanJordanKazakhstanKenyaKoreaKuwaitLaosLatin AmericaLatviaLebanonLiberiaLithuaniaMalaysiaMexicoMicronesiaMiddle AfricaMoldovaMoroccoNepalNetherlandsNicaraguaNigeriaNorth AmericaNorth MacedoniaNorthern AfricaNorthern EuropeNorwayOceaniaPakistanPanamaPeruPhilippinesPolandPortugalRomaniaRussiaSaudi ArabiaScotlandSenegalSerbiaSierra LeoneSingaporeSomaliaSouth AfricaSouth AmericaSouth Central AsiaSouth Eastern AsiaSouthern EuropeSpainSri LankaSt. Vincent and the GrenadinesSudanSwedenSwitzerlandSyriaTaiwanThailandTrinidad and TobagoTurkeyUgandaUkraineUruguayUzbekistanVenezuelaVietnamWest IndiesWestern AfricaWestern AsiaWestern EuropeYemenZaireZimbabweAzores
Immigrants from Fiji
Race
Ancestry
AfghanAfricanAlaska NativeAlaskan AthabascanAlbanianAleutAlsatianAmericanApacheArabArapahoArgentineanArmenianAustralianAustrianBahamianBangladeshiBarbadianBasqueBelgianBelizeanBermudanBhutaneseBlackfeetBolivianBrazilianBritishBritish West IndianBulgarianBurmeseCajunCambodianCanadianCape VerdeanCarpatho RusynCelticCentral AmericanCentral American IndianCherokeeCheyenneChickasawChileanChineseChippewaChoctawColombianColvilleComancheCosta RicanCreeCreekCroatianCrowCubanCypriotCzechCzechoslovakianDanishDelawareDominicanDutchDutch West IndianEastern EuropeanEcuadorianEgyptianEnglishEstonianEthiopianEuropeanFijianFilipinoFinnishFrenchFrench American IndianFrench CanadianGermanGerman RussianGhanaianGreekGuamanian/ChamorroGuatemalanGuyaneseHaitianHmongHonduranHopiHoumaHungarianIcelanderIndian (Asian)IndonesianInupiatIranianIraqiIrishIroquoisIsraeliItalianJamaicanJapaneseJordanianKenyanKiowaKoreanLaotianLatvianLebaneseLiberianLithuanianLumbeeLuxembourgerMacedonianMalaysianMalteseMarshalleseMenomineeMexicanMexican American IndianMongolianMoroccanNative HawaiianNavajoNepaleseNew ZealanderNicaraguanNigerianNorthern EuropeanNorwegianOkinawanOsageOttawaPaiutePakistaniPalestinianPanamanianParaguayanPennsylvania GermanPeruvianPimaPolishPortuguesePotawatomiPuebloPuerto RicanPuget Sound SalishRomanianRussianSalvadoranSamoanScandinavianScotch-IrishScottishSeminoleSenegaleseSerbianShoshoneSierra LeoneanSiouxSlavicSlovakSloveneSomaliSouth AfricanSouth AmericanSouth American IndianSoviet UnionSpaniardSpanishSpanish AmericanSpanish American IndianSri LankanSubsaharan AfricanSudaneseSwedishSwissSyrianTaiwaneseThaiTlingit-HaidaTohono O'OdhamTonganTrinidadian and TobagonianTsimshianTurkishU.S. Virgin IslanderUgandanUkrainianUruguayanUteVenezuelanVietnameseWelshWest IndianYakamaYaquiYugoslavianYumanYup'ikZimbabwean
Immigration
NonimmigrantsImmigrantsAfghanistanAfricaAlbaniaArgentinaArmeniaAsiaAustraliaAustriaBahamasBangladeshBarbadosBelarusBelgiumBelizeBoliviaBosnia and HerzegovinaBrazilBulgariaBurma/MyanmarCabo VerdeCambodiaCameroonCanadaCaribbeanCentral AmericaChileChinaColombiaCongoCosta RicaCroatiaCubaCzechoslovakiaDenmarkDominicaDominican RepublicEastern AfricaEastern AsiaEastern EuropeEcuadorEgyptEl SalvadorEnglandEritreaEthiopiaEuropeFijiFranceGermanyGhanaGreeceGrenadaGuatemalaGuyanaHaitiHondurasHong KongHungaryIndiaIndonesiaIranIraqIrelandIsraelItalyJamaicaJapanJordanKazakhstanKenyaKoreaKuwaitLaosLatin AmericaLatviaLebanonLiberiaLithuaniaMalaysiaMexicoMicronesiaMiddle AfricaMoldovaMoroccoNepalNetherlandsNicaraguaNigeriaNorth AmericaNorth MacedoniaNorthern AfricaNorthern EuropeNorwayOceaniaPakistanPanamaPeruPhilippinesPolandPortugalRomaniaRussiaSaudi ArabiaScotlandSenegalSerbiaSierra LeoneSingaporeSomaliaSouth AfricaSouth AmericaSouth Central AsiaSouth Eastern AsiaSouthern EuropeSpainSri LankaSt. Vincent and the GrenadinesSudanSwedenSwitzerlandSyriaTaiwanThailandTrinidad and TobagoTurkeyUgandaUkraineUruguayUzbekistanVenezuelaVietnamWest IndiesWestern AfricaWestern AsiaWestern EuropeYemenZaireZimbabweAzores
12th Grade, No Diploma
Income
Poverty
Unemployment
Labor Participation
Family Structure
Vehicle Availability
Education Level
Disability

12th Grade, No Diploma Comparison

Assyrians/Chaldeans/Syriacs

Immigrants from Fiji

Excellent
Tragic
91.8%
12TH GRADE, NO DIPLOMA
89.6/ 100
METRIC RATING
130th/ 347
METRIC RANK
88.6%
12TH GRADE, NO DIPLOMA
0.0/ 100
METRIC RATING
288th/ 347
METRIC RANK

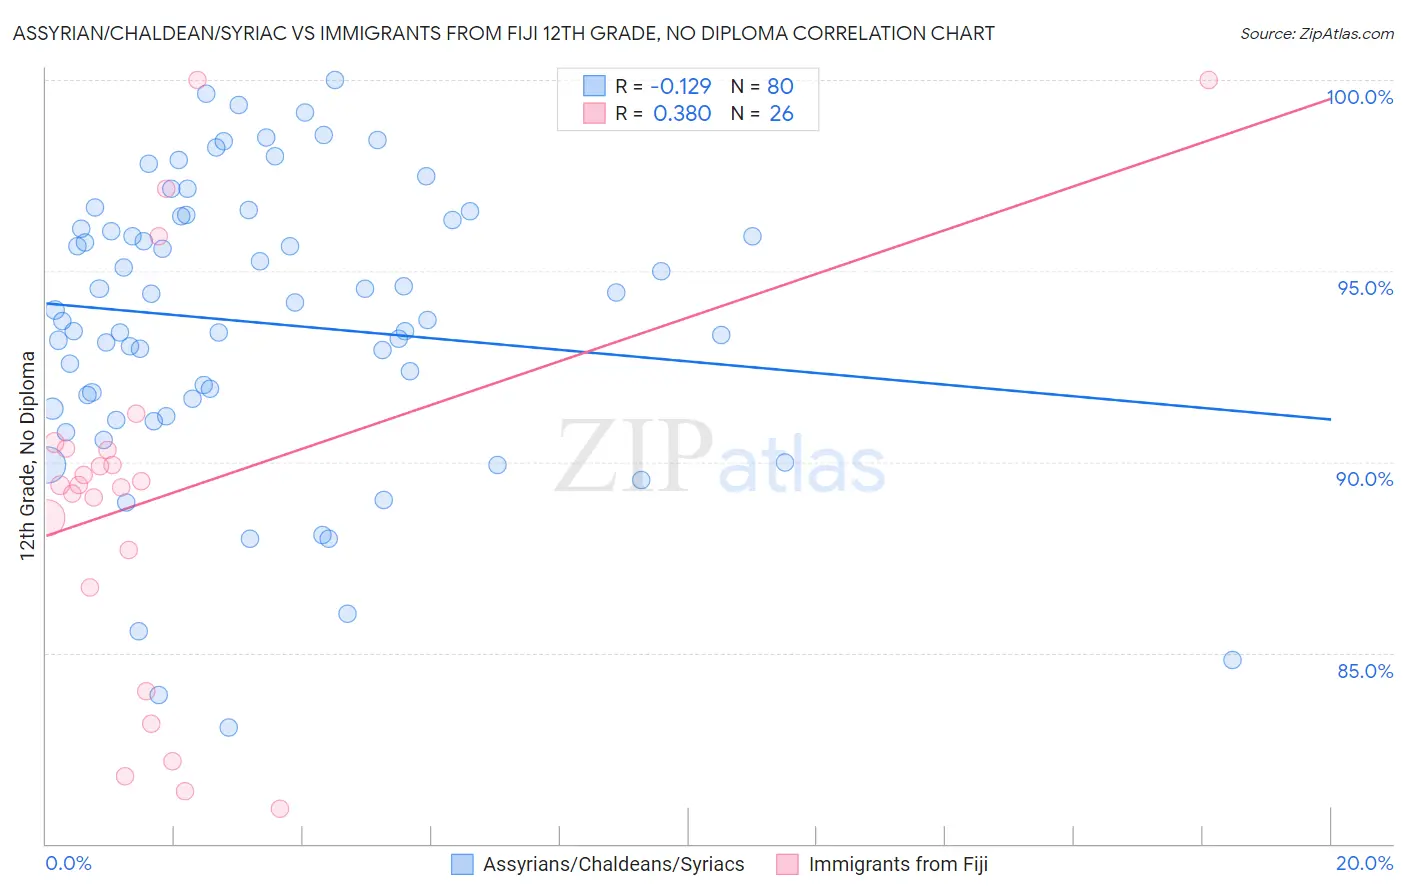
Assyrian/Chaldean/Syriac vs Immigrants from Fiji 12th Grade, No Diploma Correlation Chart

The statistical analysis conducted on geographies consisting of 110,318,125 people shows a poor negative correlation between the proportion of Assyrians/Chaldeans/Syriacs and percentage of population with at least 12th grade (no diploma) education in the United States with a correlation coefficient (R) of -0.129 and weighted average of 91.8%. Similarly, the statistical analysis conducted on geographies consisting of 93,756,204 people shows a mild positive correlation between the proportion of Immigrants from Fiji and percentage of population with at least 12th grade (no diploma) education in the United States with a correlation coefficient (R) of 0.380 and weighted average of 88.6%, a difference of 3.5%.
Assyrian/Chaldean/Syriac vs Immigrants from Fiji 12th Grade, No Diploma

12th Grade, No Diploma Correlation Summary

MeasurementAssyrian/Chaldean/SyriacImmigrants from Fiji
Minimum83.1%80.9%
Maximum100.0%100.0%
Range16.9%19.1%
Mean93.6%89.1%
Median93.8%89.4%
Interquartile 25% (IQ1)91.5%86.7%
Interquartile 75% (IQ3)96.4%90.3%
Interquartile Range (IQR)4.9%3.6%
Standard Deviation (Sample)3.8%5.1%
Standard Deviation (Population)3.7%5.0%

Similar Demographics by 12th Grade, No Diploma

Demographics Similar to Assyrians/Chaldeans/Syriacs by 12th Grade, No Diploma

In terms of 12th grade, no diploma, the demographic groups most similar to Assyrians/Chaldeans/Syriacs are German Russian (91.8%, a difference of 0.0%), Mongolian (91.8%, a difference of 0.010%), Albanian (91.8%, a difference of 0.010%), Immigrants from Eastern Asia (91.8%, a difference of 0.010%), and Immigrants from Italy (91.7%, a difference of 0.040%).
DemographicsRating | Rank12th Grade, No Diploma
Egyptians
92.5
/100
|
#123
Exceptional
91.9%
Immigrants | Ukraine
91.6
/100
|
#124
Exceptional
91.8%
Whites/Caucasians
91.6
/100
|
#125
Exceptional
91.8%
Basques
91.3
/100
|
#126
Exceptional
91.8%
Immigrants | Jordan
91.0
/100
|
#127
Exceptional
91.8%
Mongolians
89.9
/100
|
#128
Excellent
91.8%
German Russians
89.8
/100
|
#129
Excellent
91.8%
Assyrians/Chaldeans/Syriacs
89.6
/100
|
#130
Excellent
91.8%
Albanians
89.3
/100
|
#131
Excellent
91.8%
Immigrants | Eastern Asia
89.3
/100
|
#132
Excellent
91.8%
Immigrants | Italy
88.3
/100
|
#133
Excellent
91.7%
Venezuelans
88.2
/100
|
#134
Excellent
91.7%
Immigrants | Bosnia and Herzegovina
87.3
/100
|
#135
Excellent
91.7%
Chileans
85.8
/100
|
#136
Excellent
91.7%
Alaska Natives
84.9
/100
|
#137
Excellent
91.6%

Demographics Similar to Immigrants from Fiji by 12th Grade, No Diploma

In terms of 12th grade, no diploma, the demographic groups most similar to Immigrants from Fiji are Hopi (88.6%, a difference of 0.0%), Indonesian (88.6%, a difference of 0.010%), Immigrants from West Indies (88.6%, a difference of 0.010%), Pennsylvania German (88.7%, a difference of 0.030%), and Paiute (88.7%, a difference of 0.040%).
DemographicsRating | Rank12th Grade, No Diploma
Cubans
0.0
/100
|
#281
Tragic
88.9%
Immigrants | Vietnam
0.0
/100
|
#282
Tragic
88.7%
Paiute
0.0
/100
|
#283
Tragic
88.7%
Pennsylvania Germans
0.0
/100
|
#284
Tragic
88.7%
Indonesians
0.0
/100
|
#285
Tragic
88.6%
Immigrants | West Indies
0.0
/100
|
#286
Tragic
88.6%
Hopi
0.0
/100
|
#287
Tragic
88.6%
Immigrants | Fiji
0.0
/100
|
#288
Tragic
88.6%
Dutch West Indians
0.0
/100
|
#289
Tragic
88.5%
British West Indians
0.0
/100
|
#290
Tragic
88.5%
Haitians
0.0
/100
|
#291
Tragic
88.5%
Immigrants | Grenada
0.0
/100
|
#292
Tragic
88.4%
Japanese
0.0
/100
|
#293
Tragic
88.3%
Guyanese
0.0
/100
|
#294
Tragic
88.3%
Immigrants | Immigrants
0.0
/100
|
#295
Tragic
88.2%