Assyrian/Chaldean/Syriac vs Cree 12th Grade, No Diploma
COMPARE
Assyrian/Chaldean/Syriac
Cree
12th Grade, No Diploma
12th Grade, No Diploma Comparison
Assyrians/Chaldeans/Syriacs
Cree
91.8%
12TH GRADE, NO DIPLOMA
89.6/ 100
METRIC RATING
130th/ 347
METRIC RANK
91.2%
12TH GRADE, NO DIPLOMA
57.0/ 100
METRIC RATING
168th/ 347
METRIC RANK
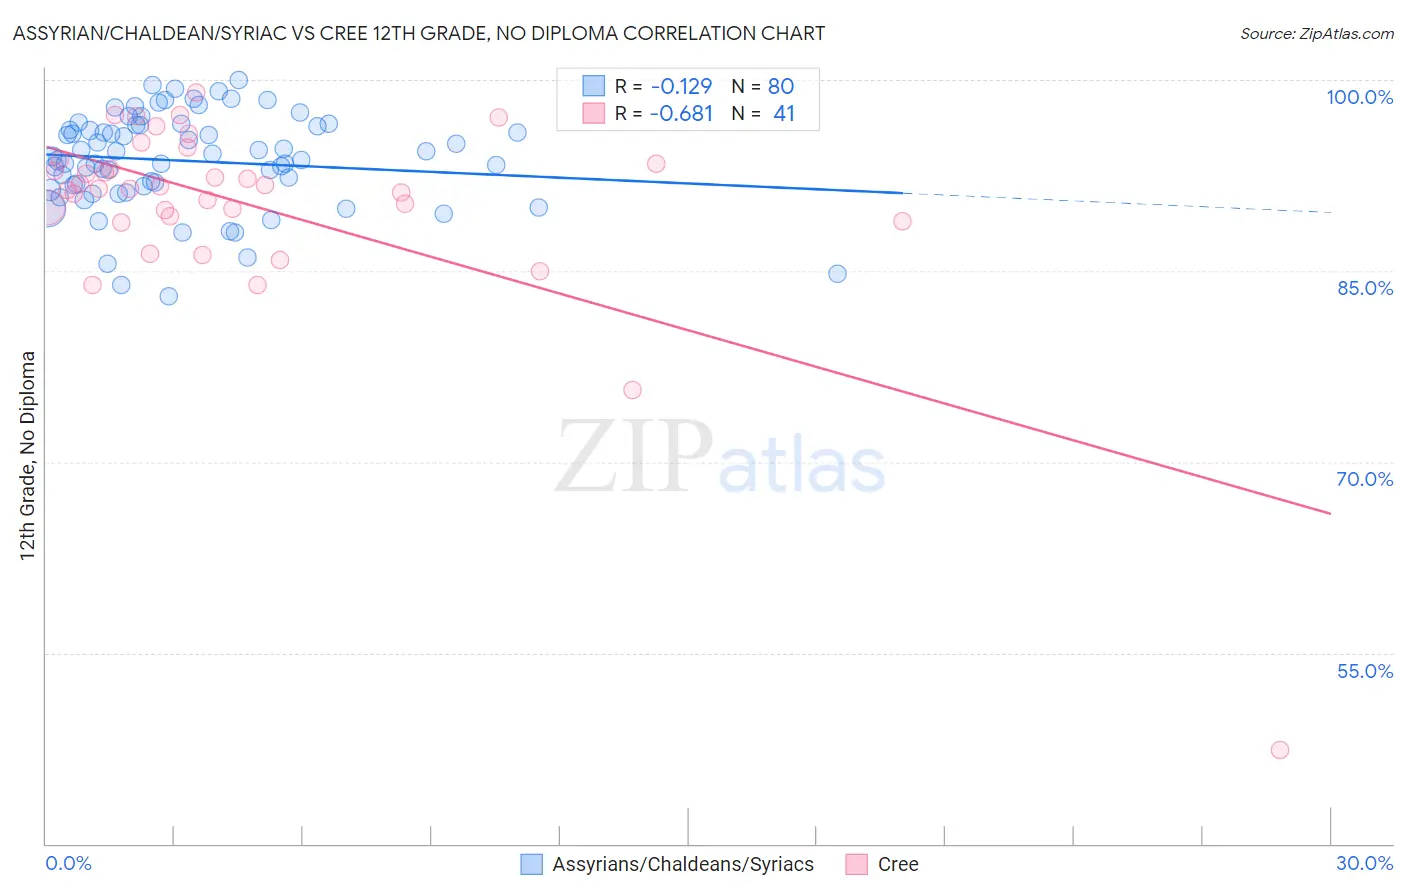
Assyrian/Chaldean/Syriac vs Cree 12th Grade, No Diploma Correlation Chart
The statistical analysis conducted on geographies consisting of 110,318,125 people shows a poor negative correlation between the proportion of Assyrians/Chaldeans/Syriacs and percentage of population with at least 12th grade (no diploma) education in the United States with a correlation coefficient (R) of -0.129 and weighted average of 91.8%. Similarly, the statistical analysis conducted on geographies consisting of 76,211,744 people shows a significant negative correlation between the proportion of Cree and percentage of population with at least 12th grade (no diploma) education in the United States with a correlation coefficient (R) of -0.681 and weighted average of 91.2%, a difference of 0.58%.
12th Grade, No Diploma Correlation Summary
| Measurement | Assyrian/Chaldean/Syriac | Cree |
| Minimum | 83.1% | 47.4% |
| Maximum | 100.0% | 99.0% |
| Range | 16.9% | 51.6% |
| Mean | 93.6% | 90.2% |
| Median | 93.8% | 91.5% |
| Interquartile 25% (IQ1) | 91.5% | 89.1% |
| Interquartile 75% (IQ3) | 96.4% | 93.6% |
| Interquartile Range (IQR) | 4.9% | 4.5% |
| Standard Deviation (Sample) | 3.8% | 8.2% |
| Standard Deviation (Population) | 3.7% | 8.1% |
Similar Demographics by 12th Grade, No Diploma
Demographics Similar to Assyrians/Chaldeans/Syriacs by 12th Grade, No Diploma
In terms of 12th grade, no diploma, the demographic groups most similar to Assyrians/Chaldeans/Syriacs are German Russian (91.8%, a difference of 0.0%), Mongolian (91.8%, a difference of 0.010%), Albanian (91.8%, a difference of 0.010%), Immigrants from Eastern Asia (91.8%, a difference of 0.010%), and Immigrants from Italy (91.7%, a difference of 0.040%).
| Demographics | Rating | Rank | 12th Grade, No Diploma |
| Egyptians | 92.5 /100 | #123 | Exceptional 91.9% |
| Immigrants | Ukraine | 91.6 /100 | #124 | Exceptional 91.8% |
| Whites/Caucasians | 91.6 /100 | #125 | Exceptional 91.8% |
| Basques | 91.3 /100 | #126 | Exceptional 91.8% |
| Immigrants | Jordan | 91.0 /100 | #127 | Exceptional 91.8% |
| Mongolians | 89.9 /100 | #128 | Excellent 91.8% |
| German Russians | 89.8 /100 | #129 | Excellent 91.8% |
| Assyrians/Chaldeans/Syriacs | 89.6 /100 | #130 | Excellent 91.8% |
| Albanians | 89.3 /100 | #131 | Excellent 91.8% |
| Immigrants | Eastern Asia | 89.3 /100 | #132 | Excellent 91.8% |
| Immigrants | Italy | 88.3 /100 | #133 | Excellent 91.7% |
| Venezuelans | 88.2 /100 | #134 | Excellent 91.7% |
| Immigrants | Bosnia and Herzegovina | 87.3 /100 | #135 | Excellent 91.7% |
| Chileans | 85.8 /100 | #136 | Excellent 91.7% |
| Alaska Natives | 84.9 /100 | #137 | Excellent 91.6% |
Demographics Similar to Cree by 12th Grade, No Diploma
In terms of 12th grade, no diploma, the demographic groups most similar to Cree are Hmong (91.3%, a difference of 0.010%), Immigrants from Malaysia (91.3%, a difference of 0.010%), Alsatian (91.3%, a difference of 0.020%), Immigrants from Indonesia (91.2%, a difference of 0.030%), and Immigrants from China (91.3%, a difference of 0.050%).
| Demographics | Rating | Rank | 12th Grade, No Diploma |
| Immigrants | Hong Kong | 63.8 /100 | #161 | Good 91.3% |
| Brazilians | 62.0 /100 | #162 | Good 91.3% |
| Immigrants | Asia | 61.5 /100 | #163 | Good 91.3% |
| Immigrants | China | 60.9 /100 | #164 | Good 91.3% |
| Alsatians | 58.3 /100 | #165 | Average 91.3% |
| Hmong | 58.0 /100 | #166 | Average 91.3% |
| Immigrants | Malaysia | 57.8 /100 | #167 | Average 91.3% |
| Cree | 57.0 /100 | #168 | Average 91.2% |
| Immigrants | Indonesia | 54.9 /100 | #169 | Average 91.2% |
| Delaware | 52.8 /100 | #170 | Average 91.2% |
| Immigrants | Morocco | 51.4 /100 | #171 | Average 91.2% |
| Bermudans | 50.8 /100 | #172 | Average 91.2% |
| Bolivians | 50.4 /100 | #173 | Average 91.2% |
| Immigrants | Nepal | 50.0 /100 | #174 | Average 91.2% |
| Immigrants | Western Asia | 49.0 /100 | #175 | Average 91.2% |