Assyrian/Chaldean/Syriac vs Immigrants from Eastern Africa 12th Grade, No Diploma
COMPARE
Assyrian/Chaldean/Syriac
Immigrants from Eastern Africa
12th Grade, No Diploma
12th Grade, No Diploma Comparison
Assyrians/Chaldeans/Syriacs
Immigrants from Eastern Africa
91.8%
12TH GRADE, NO DIPLOMA
89.6/ 100
METRIC RATING
130th/ 347
METRIC RANK
90.9%
12TH GRADE, NO DIPLOMA
27.7/ 100
METRIC RATING
192nd/ 347
METRIC RANK
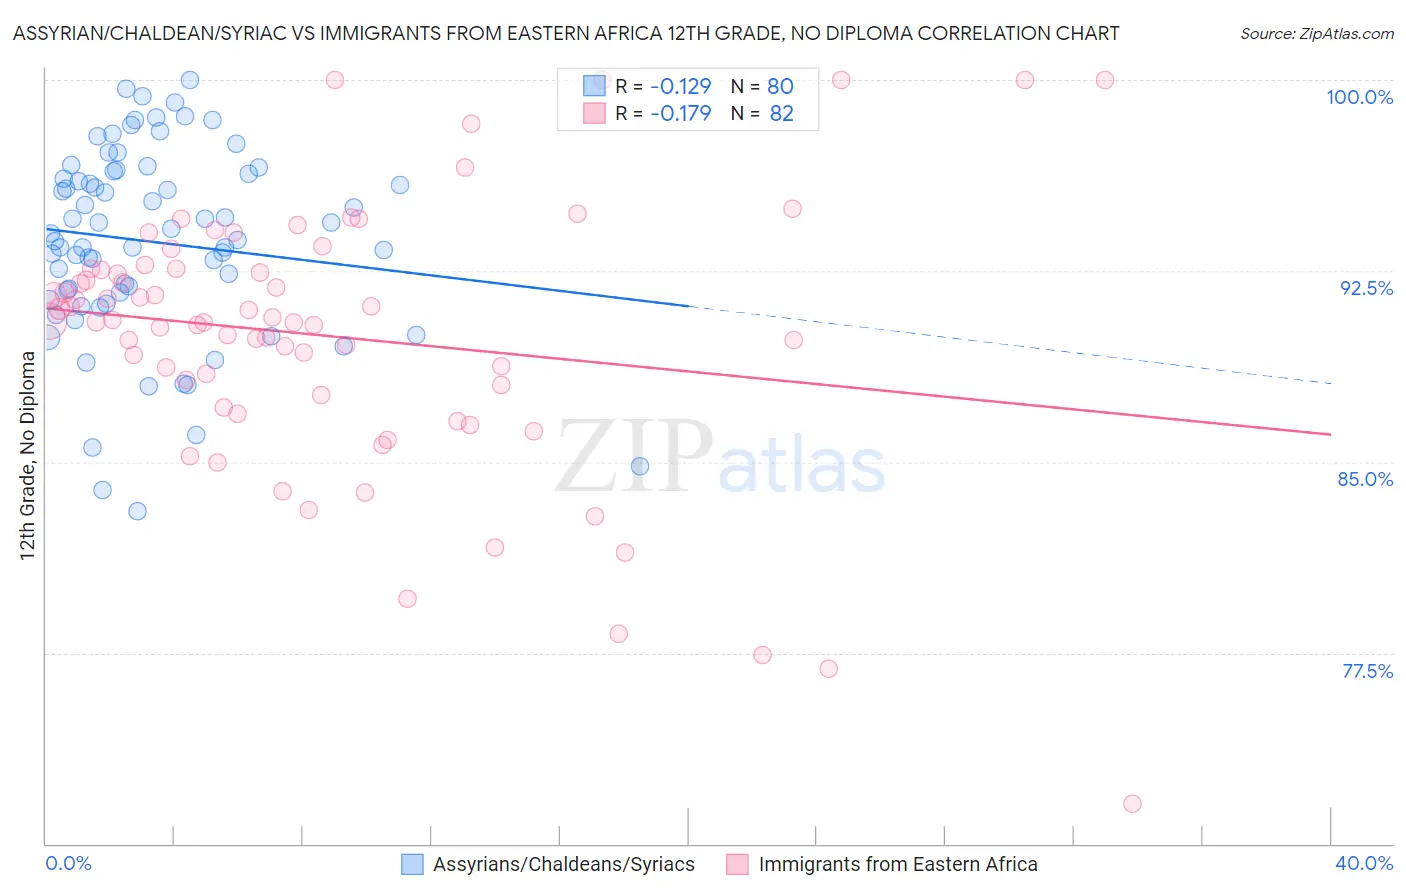
Assyrian/Chaldean/Syriac vs Immigrants from Eastern Africa 12th Grade, No Diploma Correlation Chart
The statistical analysis conducted on geographies consisting of 110,318,125 people shows a poor negative correlation between the proportion of Assyrians/Chaldeans/Syriacs and percentage of population with at least 12th grade (no diploma) education in the United States with a correlation coefficient (R) of -0.129 and weighted average of 91.8%. Similarly, the statistical analysis conducted on geographies consisting of 355,153,076 people shows a poor negative correlation between the proportion of Immigrants from Eastern Africa and percentage of population with at least 12th grade (no diploma) education in the United States with a correlation coefficient (R) of -0.179 and weighted average of 90.9%, a difference of 0.96%.
12th Grade, No Diploma Correlation Summary
| Measurement | Assyrian/Chaldean/Syriac | Immigrants from Eastern Africa |
| Minimum | 83.1% | 71.6% |
| Maximum | 100.0% | 100.0% |
| Range | 16.9% | 28.4% |
| Mean | 93.6% | 89.9% |
| Median | 93.8% | 90.5% |
| Interquartile 25% (IQ1) | 91.5% | 87.6% |
| Interquartile 75% (IQ3) | 96.4% | 92.6% |
| Interquartile Range (IQR) | 4.9% | 4.9% |
| Standard Deviation (Sample) | 3.8% | 5.3% |
| Standard Deviation (Population) | 3.7% | 5.3% |
Similar Demographics by 12th Grade, No Diploma
Demographics Similar to Assyrians/Chaldeans/Syriacs by 12th Grade, No Diploma
In terms of 12th grade, no diploma, the demographic groups most similar to Assyrians/Chaldeans/Syriacs are German Russian (91.8%, a difference of 0.0%), Mongolian (91.8%, a difference of 0.010%), Albanian (91.8%, a difference of 0.010%), Immigrants from Eastern Asia (91.8%, a difference of 0.010%), and Immigrants from Italy (91.7%, a difference of 0.040%).
| Demographics | Rating | Rank | 12th Grade, No Diploma |
| Egyptians | 92.5 /100 | #123 | Exceptional 91.9% |
| Immigrants | Ukraine | 91.6 /100 | #124 | Exceptional 91.8% |
| Whites/Caucasians | 91.6 /100 | #125 | Exceptional 91.8% |
| Basques | 91.3 /100 | #126 | Exceptional 91.8% |
| Immigrants | Jordan | 91.0 /100 | #127 | Exceptional 91.8% |
| Mongolians | 89.9 /100 | #128 | Excellent 91.8% |
| German Russians | 89.8 /100 | #129 | Excellent 91.8% |
| Assyrians/Chaldeans/Syriacs | 89.6 /100 | #130 | Excellent 91.8% |
| Albanians | 89.3 /100 | #131 | Excellent 91.8% |
| Immigrants | Eastern Asia | 89.3 /100 | #132 | Excellent 91.8% |
| Immigrants | Italy | 88.3 /100 | #133 | Excellent 91.7% |
| Venezuelans | 88.2 /100 | #134 | Excellent 91.7% |
| Immigrants | Bosnia and Herzegovina | 87.3 /100 | #135 | Excellent 91.7% |
| Chileans | 85.8 /100 | #136 | Excellent 91.7% |
| Alaska Natives | 84.9 /100 | #137 | Excellent 91.6% |
Demographics Similar to Immigrants from Eastern Africa by 12th Grade, No Diploma
In terms of 12th grade, no diploma, the demographic groups most similar to Immigrants from Eastern Africa are Immigrants from Ethiopia (90.9%, a difference of 0.010%), Moroccan (90.9%, a difference of 0.020%), Afghan (90.9%, a difference of 0.030%), Immigrants from Oceania (90.9%, a difference of 0.030%), and Korean (90.8%, a difference of 0.050%).
| Demographics | Rating | Rank | 12th Grade, No Diploma |
| Sudanese | 34.4 /100 | #185 | Fair 91.0% |
| Ethiopians | 33.9 /100 | #186 | Fair 91.0% |
| Potawatomi | 32.9 /100 | #187 | Fair 91.0% |
| Americans | 32.6 /100 | #188 | Fair 91.0% |
| Immigrants | Uganda | 31.6 /100 | #189 | Fair 90.9% |
| Afghans | 29.9 /100 | #190 | Fair 90.9% |
| Moroccans | 28.8 /100 | #191 | Fair 90.9% |
| Immigrants | Eastern Africa | 27.7 /100 | #192 | Fair 90.9% |
| Immigrants | Ethiopia | 27.2 /100 | #193 | Fair 90.9% |
| Immigrants | Oceania | 26.0 /100 | #194 | Fair 90.9% |
| Koreans | 24.5 /100 | #195 | Fair 90.8% |
| Panamanians | 22.8 /100 | #196 | Fair 90.8% |
| Immigrants | Sudan | 22.6 /100 | #197 | Fair 90.8% |
| Samoans | 20.4 /100 | #198 | Fair 90.8% |
| Immigrants | Southern Europe | 19.9 /100 | #199 | Poor 90.8% |