Assyrian/Chaldean/Syriac vs Pima 12th Grade, No Diploma
COMPARE
Assyrian/Chaldean/Syriac
Pima
12th Grade, No Diploma
12th Grade, No Diploma Comparison
Assyrians/Chaldeans/Syriacs
Pima
91.8%
12TH GRADE, NO DIPLOMA
89.6/ 100
METRIC RATING
130th/ 347
METRIC RANK
84.6%
12TH GRADE, NO DIPLOMA
0.0/ 100
METRIC RATING
337th/ 347
METRIC RANK
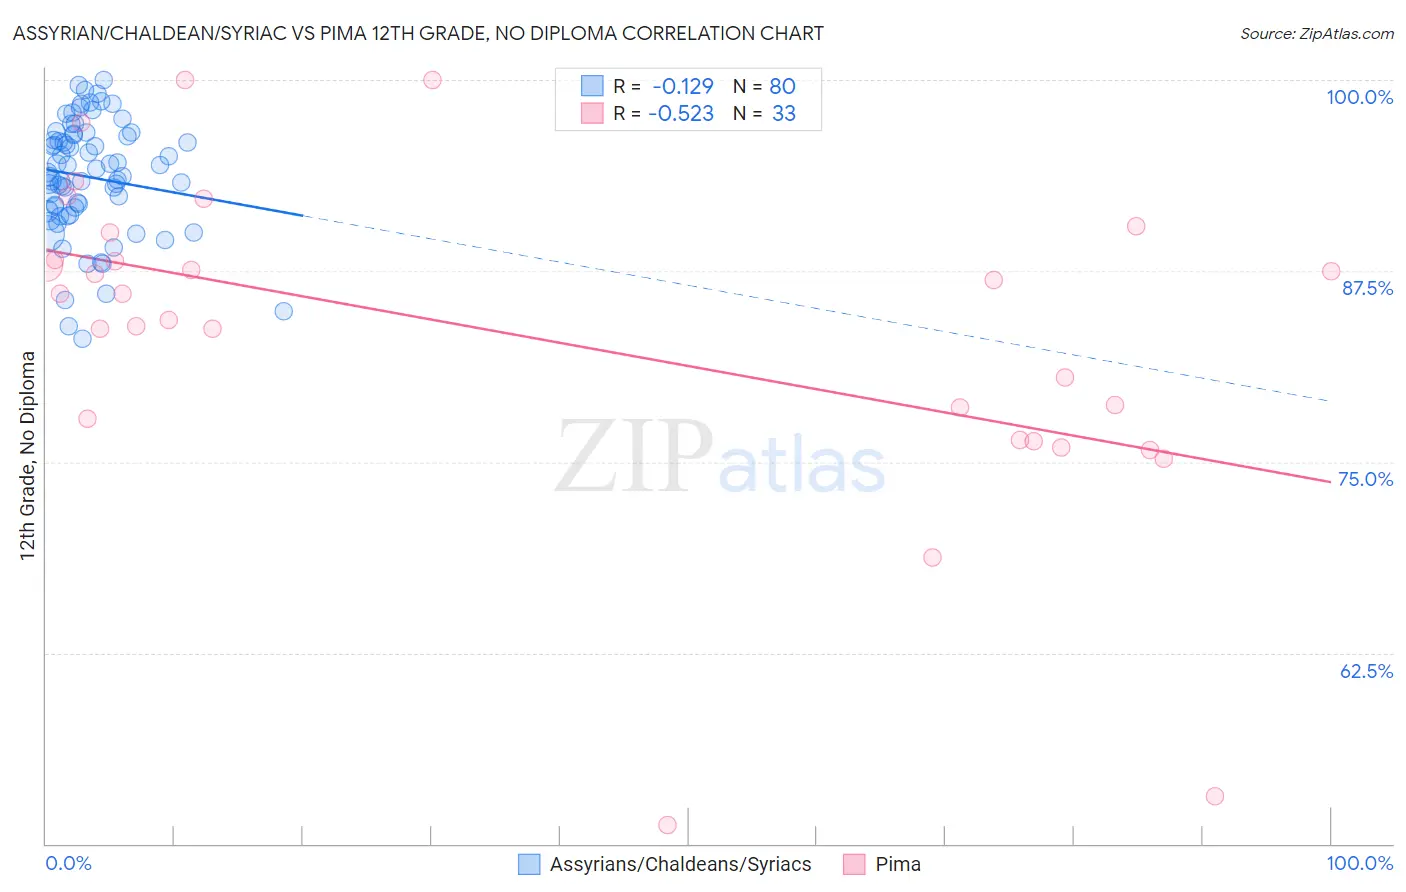
Assyrian/Chaldean/Syriac vs Pima 12th Grade, No Diploma Correlation Chart
The statistical analysis conducted on geographies consisting of 110,318,125 people shows a poor negative correlation between the proportion of Assyrians/Chaldeans/Syriacs and percentage of population with at least 12th grade (no diploma) education in the United States with a correlation coefficient (R) of -0.129 and weighted average of 91.8%. Similarly, the statistical analysis conducted on geographies consisting of 61,552,828 people shows a substantial negative correlation between the proportion of Pima and percentage of population with at least 12th grade (no diploma) education in the United States with a correlation coefficient (R) of -0.523 and weighted average of 84.6%, a difference of 8.5%.
12th Grade, No Diploma Correlation Summary
| Measurement | Assyrian/Chaldean/Syriac | Pima |
| Minimum | 83.1% | 51.2% |
| Maximum | 100.0% | 100.0% |
| Range | 16.9% | 48.8% |
| Mean | 93.6% | 83.2% |
| Median | 93.8% | 86.0% |
| Interquartile 25% (IQ1) | 91.5% | 77.1% |
| Interquartile 75% (IQ3) | 96.4% | 89.1% |
| Interquartile Range (IQR) | 4.9% | 12.0% |
| Standard Deviation (Sample) | 3.8% | 10.9% |
| Standard Deviation (Population) | 3.7% | 10.7% |
Similar Demographics by 12th Grade, No Diploma
Demographics Similar to Assyrians/Chaldeans/Syriacs by 12th Grade, No Diploma
In terms of 12th grade, no diploma, the demographic groups most similar to Assyrians/Chaldeans/Syriacs are German Russian (91.8%, a difference of 0.0%), Mongolian (91.8%, a difference of 0.010%), Albanian (91.8%, a difference of 0.010%), Immigrants from Eastern Asia (91.8%, a difference of 0.010%), and Immigrants from Italy (91.7%, a difference of 0.040%).
| Demographics | Rating | Rank | 12th Grade, No Diploma |
| Egyptians | 92.5 /100 | #123 | Exceptional 91.9% |
| Immigrants | Ukraine | 91.6 /100 | #124 | Exceptional 91.8% |
| Whites/Caucasians | 91.6 /100 | #125 | Exceptional 91.8% |
| Basques | 91.3 /100 | #126 | Exceptional 91.8% |
| Immigrants | Jordan | 91.0 /100 | #127 | Exceptional 91.8% |
| Mongolians | 89.9 /100 | #128 | Excellent 91.8% |
| German Russians | 89.8 /100 | #129 | Excellent 91.8% |
| Assyrians/Chaldeans/Syriacs | 89.6 /100 | #130 | Excellent 91.8% |
| Albanians | 89.3 /100 | #131 | Excellent 91.8% |
| Immigrants | Eastern Asia | 89.3 /100 | #132 | Excellent 91.8% |
| Immigrants | Italy | 88.3 /100 | #133 | Excellent 91.7% |
| Venezuelans | 88.2 /100 | #134 | Excellent 91.7% |
| Immigrants | Bosnia and Herzegovina | 87.3 /100 | #135 | Excellent 91.7% |
| Chileans | 85.8 /100 | #136 | Excellent 91.7% |
| Alaska Natives | 84.9 /100 | #137 | Excellent 91.6% |
Demographics Similar to Pima by 12th Grade, No Diploma
In terms of 12th grade, no diploma, the demographic groups most similar to Pima are Guatemalan (84.6%, a difference of 0.040%), Tohono O'odham (84.7%, a difference of 0.13%), Salvadoran (84.5%, a difference of 0.14%), Immigrants from Yemen (84.8%, a difference of 0.28%), and Immigrants from Dominican Republic (84.9%, a difference of 0.32%).
| Demographics | Rating | Rank | 12th Grade, No Diploma |
| Immigrants | Azores | 0.0 /100 | #330 | Tragic 85.3% |
| Central Americans | 0.0 /100 | #331 | Tragic 85.2% |
| Immigrants | Honduras | 0.0 /100 | #332 | Tragic 85.0% |
| Immigrants | Latin America | 0.0 /100 | #333 | Tragic 85.0% |
| Immigrants | Dominican Republic | 0.0 /100 | #334 | Tragic 84.9% |
| Immigrants | Yemen | 0.0 /100 | #335 | Tragic 84.8% |
| Tohono O'odham | 0.0 /100 | #336 | Tragic 84.7% |
| Pima | 0.0 /100 | #337 | Tragic 84.6% |
| Guatemalans | 0.0 /100 | #338 | Tragic 84.6% |
| Salvadorans | 0.0 /100 | #339 | Tragic 84.5% |
| Mexicans | 0.0 /100 | #340 | Tragic 84.1% |
| Immigrants | Guatemala | 0.0 /100 | #341 | Tragic 84.0% |
| Houma | 0.0 /100 | #342 | Tragic 83.7% |
| Immigrants | El Salvador | 0.0 /100 | #343 | Tragic 83.6% |
| Immigrants | Central America | 0.0 /100 | #344 | Tragic 83.0% |