Assyrian/Chaldean/Syriac vs Immigrants from Iran 11th Grade
COMPARE
Assyrian/Chaldean/Syriac
Immigrants from Iran
11th Grade
11th Grade Comparison
Assyrians/Chaldeans/Syriacs
Immigrants from Iran
92.8%
11TH GRADE
80.5/ 100
METRIC RATING
144th/ 347
METRIC RANK
93.5%
11TH GRADE
98.9/ 100
METRIC RATING
97th/ 347
METRIC RANK
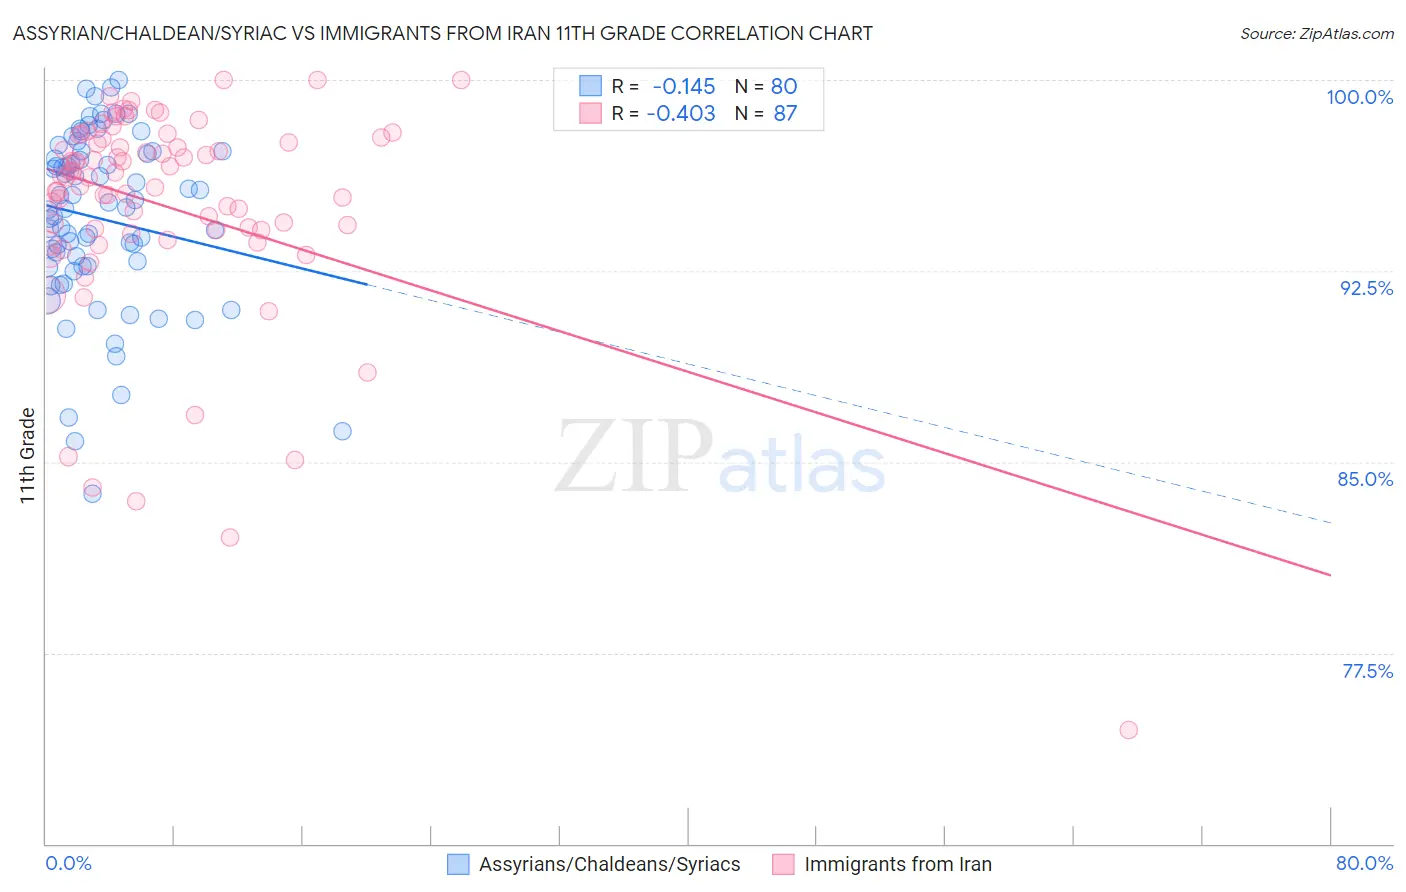
Assyrian/Chaldean/Syriac vs Immigrants from Iran 11th Grade Correlation Chart
The statistical analysis conducted on geographies consisting of 110,318,125 people shows a poor negative correlation between the proportion of Assyrians/Chaldeans/Syriacs and percentage of population with at least 11th grade education in the United States with a correlation coefficient (R) of -0.145 and weighted average of 92.8%. Similarly, the statistical analysis conducted on geographies consisting of 279,905,207 people shows a moderate negative correlation between the proportion of Immigrants from Iran and percentage of population with at least 11th grade education in the United States with a correlation coefficient (R) of -0.403 and weighted average of 93.5%, a difference of 0.74%.
11th Grade Correlation Summary
| Measurement | Assyrian/Chaldean/Syriac | Immigrants from Iran |
| Minimum | 83.8% | 74.5% |
| Maximum | 100.0% | 100.0% |
| Range | 16.2% | 25.5% |
| Mean | 94.6% | 95.0% |
| Median | 95.0% | 96.2% |
| Interquartile 25% (IQ1) | 92.7% | 94.1% |
| Interquartile 75% (IQ3) | 97.1% | 97.7% |
| Interquartile Range (IQR) | 4.5% | 3.6% |
| Standard Deviation (Sample) | 3.4% | 4.3% |
| Standard Deviation (Population) | 3.4% | 4.3% |
Similar Demographics by 11th Grade
Demographics Similar to Assyrians/Chaldeans/Syriacs by 11th Grade
In terms of 11th grade, the demographic groups most similar to Assyrians/Chaldeans/Syriacs are Pakistani (92.8%, a difference of 0.010%), Ugandan (92.9%, a difference of 0.020%), Iroquois (92.8%, a difference of 0.020%), Kenyan (92.9%, a difference of 0.030%), and Immigrants from Kenya (92.8%, a difference of 0.030%).
| Demographics | Rating | Rank | 11th Grade |
| Arabs | 85.4 /100 | #137 | Excellent 92.9% |
| Immigrants | Brazil | 85.1 /100 | #138 | Excellent 92.9% |
| Crow | 84.1 /100 | #139 | Excellent 92.9% |
| Venezuelans | 83.4 /100 | #140 | Excellent 92.9% |
| Chileans | 83.0 /100 | #141 | Excellent 92.9% |
| Kenyans | 82.0 /100 | #142 | Excellent 92.9% |
| Ugandans | 81.4 /100 | #143 | Excellent 92.9% |
| Assyrians/Chaldeans/Syriacs | 80.5 /100 | #144 | Excellent 92.8% |
| Pakistanis | 79.6 /100 | #145 | Good 92.8% |
| Iroquois | 79.1 /100 | #146 | Good 92.8% |
| Immigrants | Kenya | 78.7 /100 | #147 | Good 92.8% |
| Hmong | 78.6 /100 | #148 | Good 92.8% |
| Immigrants | Poland | 78.5 /100 | #149 | Good 92.8% |
| Immigrants | Egypt | 77.5 /100 | #150 | Good 92.8% |
| Potawatomi | 74.3 /100 | #151 | Good 92.8% |
Demographics Similar to Immigrants from Iran by 11th Grade
In terms of 11th grade, the demographic groups most similar to Immigrants from Iran are Immigrants from Turkey (93.5%, a difference of 0.010%), Immigrants from Israel (93.5%, a difference of 0.020%), Menominee (93.5%, a difference of 0.020%), Swiss (93.6%, a difference of 0.030%), and Immigrants from France (93.6%, a difference of 0.030%).
| Demographics | Rating | Rank | 11th Grade |
| Ottawa | 99.2 /100 | #90 | Exceptional 93.6% |
| South Africans | 99.2 /100 | #91 | Exceptional 93.6% |
| Immigrants | Bulgaria | 99.1 /100 | #92 | Exceptional 93.6% |
| Puget Sound Salish | 99.1 /100 | #93 | Exceptional 93.6% |
| Swiss | 99.0 /100 | #94 | Exceptional 93.6% |
| Immigrants | France | 99.0 /100 | #95 | Exceptional 93.6% |
| Immigrants | Turkey | 98.9 /100 | #96 | Exceptional 93.5% |
| Immigrants | Iran | 98.9 /100 | #97 | Exceptional 93.5% |
| Immigrants | Israel | 98.8 /100 | #98 | Exceptional 93.5% |
| Menominee | 98.7 /100 | #99 | Exceptional 93.5% |
| Immigrants | North Macedonia | 98.7 /100 | #100 | Exceptional 93.5% |
| Immigrants | Romania | 98.7 /100 | #101 | Exceptional 93.5% |
| Chippewa | 98.6 /100 | #102 | Exceptional 93.5% |
| Lebanese | 98.6 /100 | #103 | Exceptional 93.5% |
| Immigrants | Europe | 98.6 /100 | #104 | Exceptional 93.5% |