Assyrian/Chaldean/Syriac vs Immigrants from North America 11th Grade
COMPARE
Assyrian/Chaldean/Syriac
Immigrants from North America
11th Grade
11th Grade Comparison
Assyrians/Chaldeans/Syriacs
Immigrants from North America
92.8%
11TH GRADE
80.5/ 100
METRIC RATING
144th/ 347
METRIC RANK
94.0%
11TH GRADE
99.9/ 100
METRIC RATING
54th/ 347
METRIC RANK
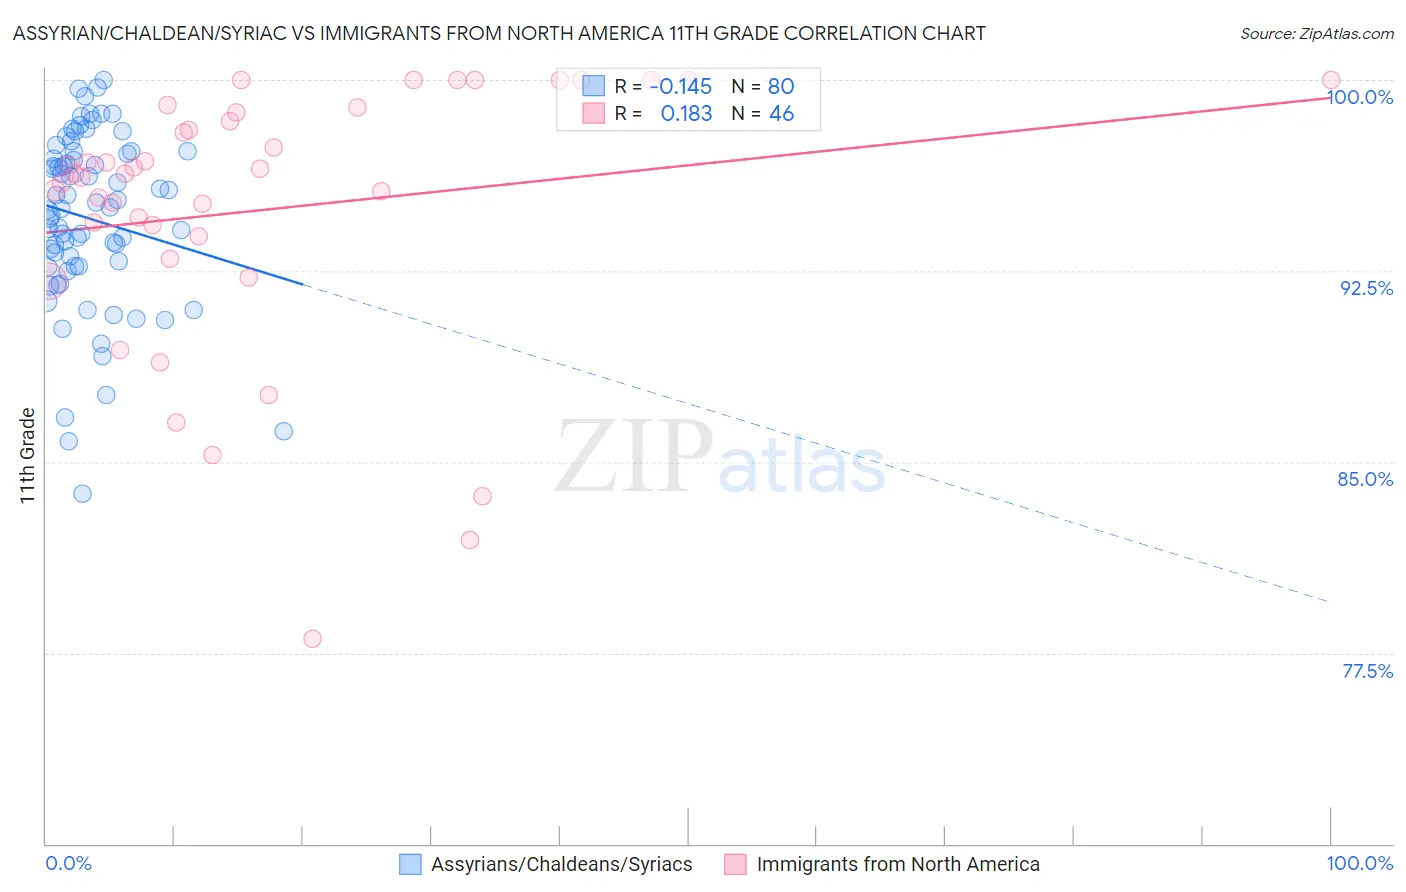
Assyrian/Chaldean/Syriac vs Immigrants from North America 11th Grade Correlation Chart
The statistical analysis conducted on geographies consisting of 110,318,125 people shows a poor negative correlation between the proportion of Assyrians/Chaldeans/Syriacs and percentage of population with at least 11th grade education in the United States with a correlation coefficient (R) of -0.145 and weighted average of 92.8%. Similarly, the statistical analysis conducted on geographies consisting of 462,461,913 people shows a poor positive correlation between the proportion of Immigrants from North America and percentage of population with at least 11th grade education in the United States with a correlation coefficient (R) of 0.183 and weighted average of 94.0%, a difference of 1.3%.
11th Grade Correlation Summary
| Measurement | Assyrian/Chaldean/Syriac | Immigrants from North America |
| Minimum | 83.8% | 78.1% |
| Maximum | 100.0% | 100.0% |
| Range | 16.2% | 21.9% |
| Mean | 94.6% | 94.9% |
| Median | 95.0% | 96.3% |
| Interquartile 25% (IQ1) | 92.7% | 93.9% |
| Interquartile 75% (IQ3) | 97.1% | 98.7% |
| Interquartile Range (IQR) | 4.5% | 4.9% |
| Standard Deviation (Sample) | 3.4% | 5.2% |
| Standard Deviation (Population) | 3.4% | 5.2% |
Similar Demographics by 11th Grade
Demographics Similar to Assyrians/Chaldeans/Syriacs by 11th Grade
In terms of 11th grade, the demographic groups most similar to Assyrians/Chaldeans/Syriacs are Pakistani (92.8%, a difference of 0.010%), Ugandan (92.9%, a difference of 0.020%), Iroquois (92.8%, a difference of 0.020%), Kenyan (92.9%, a difference of 0.030%), and Immigrants from Kenya (92.8%, a difference of 0.030%).
| Demographics | Rating | Rank | 11th Grade |
| Arabs | 85.4 /100 | #137 | Excellent 92.9% |
| Immigrants | Brazil | 85.1 /100 | #138 | Excellent 92.9% |
| Crow | 84.1 /100 | #139 | Excellent 92.9% |
| Venezuelans | 83.4 /100 | #140 | Excellent 92.9% |
| Chileans | 83.0 /100 | #141 | Excellent 92.9% |
| Kenyans | 82.0 /100 | #142 | Excellent 92.9% |
| Ugandans | 81.4 /100 | #143 | Excellent 92.9% |
| Assyrians/Chaldeans/Syriacs | 80.5 /100 | #144 | Excellent 92.8% |
| Pakistanis | 79.6 /100 | #145 | Good 92.8% |
| Iroquois | 79.1 /100 | #146 | Good 92.8% |
| Immigrants | Kenya | 78.7 /100 | #147 | Good 92.8% |
| Hmong | 78.6 /100 | #148 | Good 92.8% |
| Immigrants | Poland | 78.5 /100 | #149 | Good 92.8% |
| Immigrants | Egypt | 77.5 /100 | #150 | Good 92.8% |
| Potawatomi | 74.3 /100 | #151 | Good 92.8% |
Demographics Similar to Immigrants from North America by 11th Grade
In terms of 11th grade, the demographic groups most similar to Immigrants from North America are Czechoslovakian (94.0%, a difference of 0.0%), Immigrants from Australia (94.0%, a difference of 0.010%), French Canadian (94.0%, a difference of 0.010%), New Zealander (94.0%, a difference of 0.010%), and Iranian (94.0%, a difference of 0.010%).
| Demographics | Rating | Rank | 11th Grade |
| Filipinos | 99.9 /100 | #47 | Exceptional 94.1% |
| Macedonians | 99.9 /100 | #48 | Exceptional 94.1% |
| Slavs | 99.9 /100 | #49 | Exceptional 94.1% |
| French | 99.9 /100 | #50 | Exceptional 94.1% |
| Turks | 99.9 /100 | #51 | Exceptional 94.0% |
| Immigrants | Canada | 99.9 /100 | #52 | Exceptional 94.0% |
| Immigrants | Australia | 99.9 /100 | #53 | Exceptional 94.0% |
| Immigrants | North America | 99.9 /100 | #54 | Exceptional 94.0% |
| Czechoslovakians | 99.9 /100 | #55 | Exceptional 94.0% |
| French Canadians | 99.9 /100 | #56 | Exceptional 94.0% |
| New Zealanders | 99.9 /100 | #57 | Exceptional 94.0% |
| Iranians | 99.9 /100 | #58 | Exceptional 94.0% |
| Bhutanese | 99.8 /100 | #59 | Exceptional 94.0% |
| Okinawans | 99.8 /100 | #60 | Exceptional 94.0% |
| Immigrants | Belgium | 99.8 /100 | #61 | Exceptional 94.0% |