French American Indian vs Immigrants from Iran 11th Grade
COMPARE
French American Indian
Immigrants from Iran
11th Grade
11th Grade Comparison
French American Indians
Immigrants from Iran
92.3%
11TH GRADE
30.8/ 100
METRIC RATING
191st/ 347
METRIC RANK
93.5%
11TH GRADE
98.9/ 100
METRIC RATING
97th/ 347
METRIC RANK
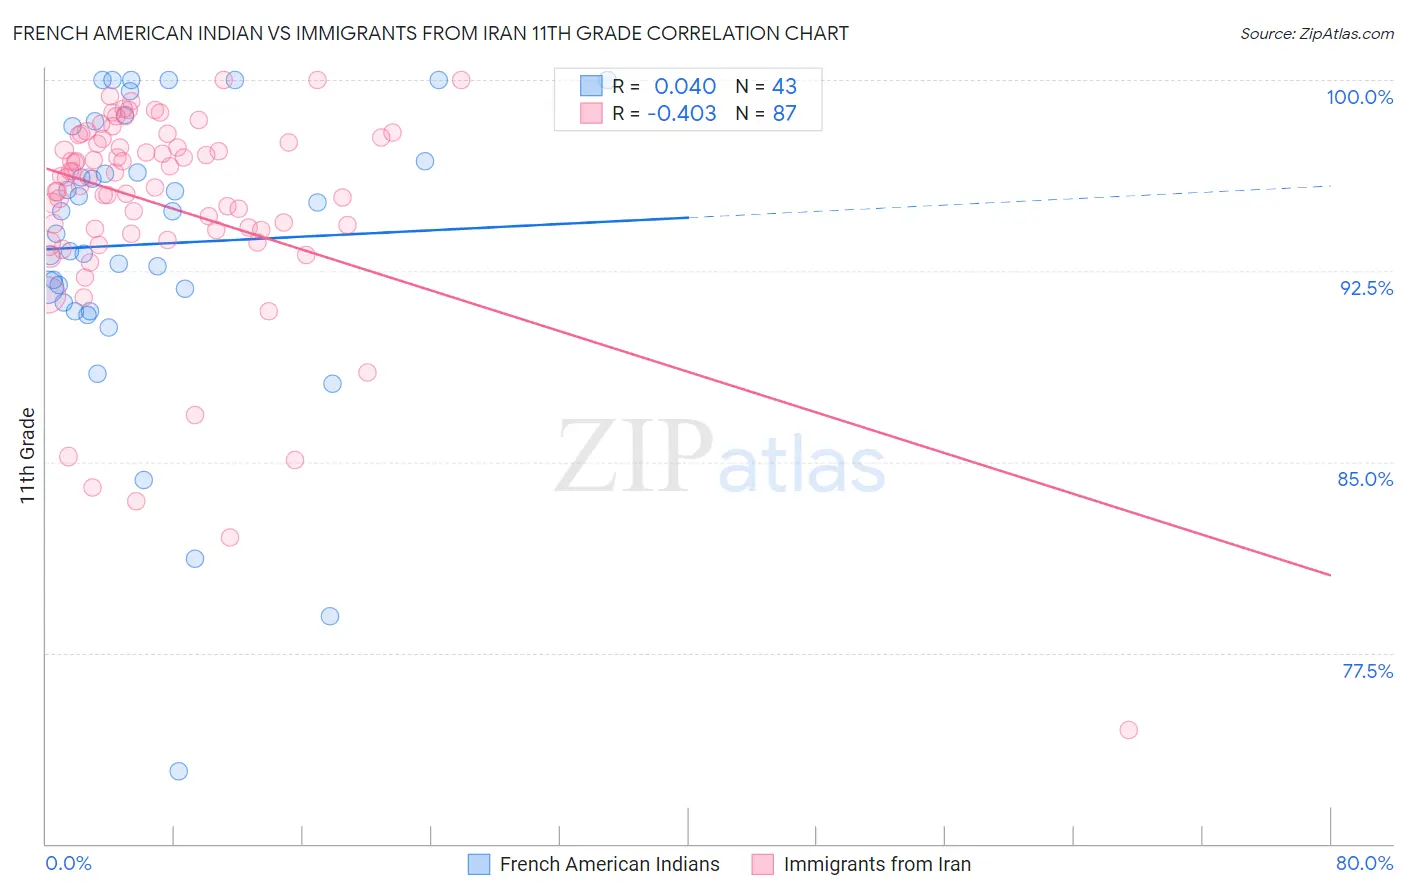
French American Indian vs Immigrants from Iran 11th Grade Correlation Chart
The statistical analysis conducted on geographies consisting of 131,976,269 people shows no correlation between the proportion of French American Indians and percentage of population with at least 11th grade education in the United States with a correlation coefficient (R) of 0.040 and weighted average of 92.3%. Similarly, the statistical analysis conducted on geographies consisting of 279,905,207 people shows a moderate negative correlation between the proportion of Immigrants from Iran and percentage of population with at least 11th grade education in the United States with a correlation coefficient (R) of -0.403 and weighted average of 93.5%, a difference of 1.3%.
11th Grade Correlation Summary
| Measurement | French American Indian | Immigrants from Iran |
| Minimum | 72.9% | 74.5% |
| Maximum | 100.0% | 100.0% |
| Range | 27.1% | 25.5% |
| Mean | 93.6% | 95.0% |
| Median | 94.8% | 96.2% |
| Interquartile 25% (IQ1) | 91.3% | 94.1% |
| Interquartile 75% (IQ3) | 98.2% | 97.7% |
| Interquartile Range (IQR) | 6.9% | 3.6% |
| Standard Deviation (Sample) | 5.9% | 4.3% |
| Standard Deviation (Population) | 5.8% | 4.3% |
Similar Demographics by 11th Grade
Demographics Similar to French American Indians by 11th Grade
In terms of 11th grade, the demographic groups most similar to French American Indians are Immigrants from Syria (92.3%, a difference of 0.0%), Chickasaw (92.3%, a difference of 0.010%), Moroccan (92.3%, a difference of 0.020%), Immigrants from Indonesia (92.4%, a difference of 0.030%), and Immigrants from Chile (92.4%, a difference of 0.030%).
| Demographics | Rating | Rank | 11th Grade |
| Immigrants | Asia | 37.4 /100 | #184 | Fair 92.4% |
| Immigrants | Nepal | 36.4 /100 | #185 | Fair 92.4% |
| Arapaho | 35.1 /100 | #186 | Fair 92.4% |
| Immigrants | Western Asia | 35.0 /100 | #187 | Fair 92.4% |
| Immigrants | Indonesia | 33.7 /100 | #188 | Fair 92.4% |
| Immigrants | Chile | 33.3 /100 | #189 | Fair 92.4% |
| Chickasaw | 31.4 /100 | #190 | Fair 92.3% |
| French American Indians | 30.8 /100 | #191 | Fair 92.3% |
| Immigrants | Syria | 30.4 /100 | #192 | Fair 92.3% |
| Moroccans | 28.7 /100 | #193 | Fair 92.3% |
| Sioux | 28.5 /100 | #194 | Fair 92.3% |
| Liberians | 26.8 /100 | #195 | Fair 92.3% |
| Panamanians | 26.4 /100 | #196 | Fair 92.3% |
| Marshallese | 26.0 /100 | #197 | Fair 92.3% |
| Hawaiians | 25.5 /100 | #198 | Fair 92.3% |
Demographics Similar to Immigrants from Iran by 11th Grade
In terms of 11th grade, the demographic groups most similar to Immigrants from Iran are Immigrants from Turkey (93.5%, a difference of 0.010%), Immigrants from Israel (93.5%, a difference of 0.020%), Menominee (93.5%, a difference of 0.020%), Swiss (93.6%, a difference of 0.030%), and Immigrants from France (93.6%, a difference of 0.030%).
| Demographics | Rating | Rank | 11th Grade |
| Ottawa | 99.2 /100 | #90 | Exceptional 93.6% |
| South Africans | 99.2 /100 | #91 | Exceptional 93.6% |
| Immigrants | Bulgaria | 99.1 /100 | #92 | Exceptional 93.6% |
| Puget Sound Salish | 99.1 /100 | #93 | Exceptional 93.6% |
| Swiss | 99.0 /100 | #94 | Exceptional 93.6% |
| Immigrants | France | 99.0 /100 | #95 | Exceptional 93.6% |
| Immigrants | Turkey | 98.9 /100 | #96 | Exceptional 93.5% |
| Immigrants | Iran | 98.9 /100 | #97 | Exceptional 93.5% |
| Immigrants | Israel | 98.8 /100 | #98 | Exceptional 93.5% |
| Menominee | 98.7 /100 | #99 | Exceptional 93.5% |
| Immigrants | North Macedonia | 98.7 /100 | #100 | Exceptional 93.5% |
| Immigrants | Romania | 98.7 /100 | #101 | Exceptional 93.5% |
| Chippewa | 98.6 /100 | #102 | Exceptional 93.5% |
| Lebanese | 98.6 /100 | #103 | Exceptional 93.5% |
| Immigrants | Europe | 98.6 /100 | #104 | Exceptional 93.5% |