Luxembourger vs Immigrants from Iran 11th Grade
COMPARE
Luxembourger
Immigrants from Iran
11th Grade
11th Grade Comparison
Luxembourgers
Immigrants from Iran
94.5%
11TH GRADE
100.0/ 100
METRIC RATING
17th/ 347
METRIC RANK
93.5%
11TH GRADE
98.9/ 100
METRIC RATING
97th/ 347
METRIC RANK
Luxembourger vs Immigrants from Iran 11th Grade Correlation Chart
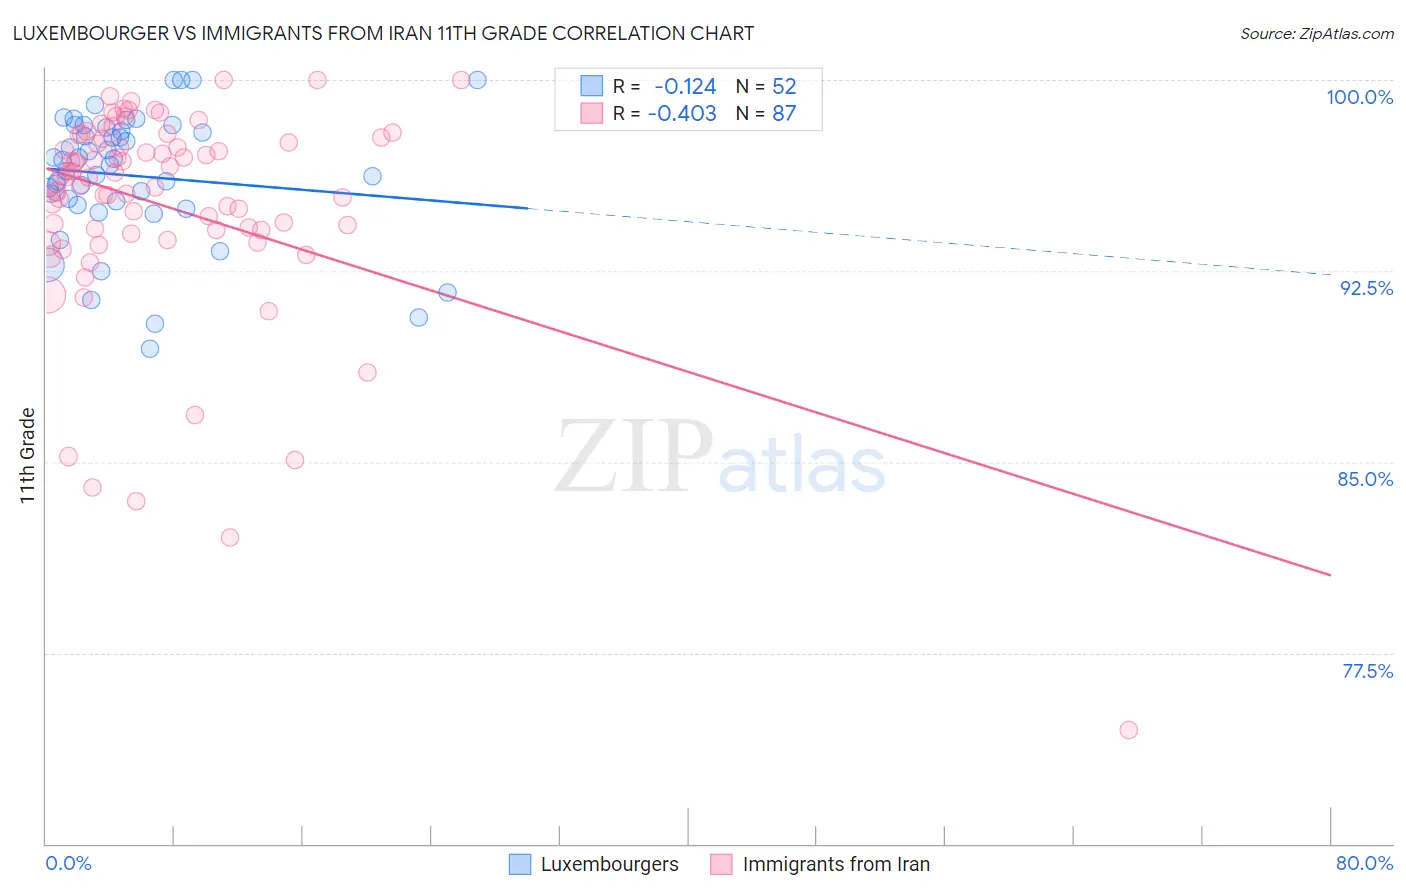
The statistical analysis conducted on geographies consisting of 144,675,955 people shows a poor negative correlation between the proportion of Luxembourgers and percentage of population with at least 11th grade education in the United States with a correlation coefficient (R) of -0.124 and weighted average of 94.5%. Similarly, the statistical analysis conducted on geographies consisting of 279,905,207 people shows a moderate negative correlation between the proportion of Immigrants from Iran and percentage of population with at least 11th grade education in the United States with a correlation coefficient (R) of -0.403 and weighted average of 93.5%, a difference of 1.0%.
11th Grade Correlation Summary
| Measurement | Luxembourger | Immigrants from Iran |
| Minimum | 89.4% | 74.5% |
| Maximum | 100.0% | 100.0% |
| Range | 10.6% | 25.5% |
| Mean | 96.2% | 95.0% |
| Median | 96.8% | 96.2% |
| Interquartile 25% (IQ1) | 95.2% | 94.1% |
| Interquartile 75% (IQ3) | 98.0% | 97.7% |
| Interquartile Range (IQR) | 2.9% | 3.6% |
| Standard Deviation (Sample) | 2.5% | 4.3% |
| Standard Deviation (Population) | 2.5% | 4.3% |
Similar Demographics by 11th Grade
Demographics Similar to Luxembourgers by 11th Grade
In terms of 11th grade, the demographic groups most similar to Luxembourgers are Immigrants from India (94.5%, a difference of 0.0%), Maltese (94.5%, a difference of 0.0%), Bulgarian (94.5%, a difference of 0.010%), Scandinavian (94.5%, a difference of 0.010%), and Italian (94.5%, a difference of 0.040%).
| Demographics | Rating | Rank | 11th Grade |
| Finns | 100.0 /100 | #10 | Exceptional 94.7% |
| Germans | 100.0 /100 | #11 | Exceptional 94.7% |
| Latvians | 100.0 /100 | #12 | Exceptional 94.7% |
| Chinese | 100.0 /100 | #13 | Exceptional 94.6% |
| Eastern Europeans | 100.0 /100 | #14 | Exceptional 94.6% |
| Bulgarians | 100.0 /100 | #15 | Exceptional 94.5% |
| Immigrants | India | 100.0 /100 | #16 | Exceptional 94.5% |
| Luxembourgers | 100.0 /100 | #17 | Exceptional 94.5% |
| Maltese | 100.0 /100 | #18 | Exceptional 94.5% |
| Scandinavians | 100.0 /100 | #19 | Exceptional 94.5% |
| Italians | 100.0 /100 | #20 | Exceptional 94.5% |
| Tlingit-Haida | 100.0 /100 | #21 | Exceptional 94.4% |
| Tsimshian | 100.0 /100 | #22 | Exceptional 94.4% |
| Czechs | 100.0 /100 | #23 | Exceptional 94.4% |
| English | 100.0 /100 | #24 | Exceptional 94.4% |
Demographics Similar to Immigrants from Iran by 11th Grade
In terms of 11th grade, the demographic groups most similar to Immigrants from Iran are Immigrants from Turkey (93.5%, a difference of 0.010%), Immigrants from Israel (93.5%, a difference of 0.020%), Menominee (93.5%, a difference of 0.020%), Swiss (93.6%, a difference of 0.030%), and Immigrants from France (93.6%, a difference of 0.030%).
| Demographics | Rating | Rank | 11th Grade |
| Ottawa | 99.2 /100 | #90 | Exceptional 93.6% |
| South Africans | 99.2 /100 | #91 | Exceptional 93.6% |
| Immigrants | Bulgaria | 99.1 /100 | #92 | Exceptional 93.6% |
| Puget Sound Salish | 99.1 /100 | #93 | Exceptional 93.6% |
| Swiss | 99.0 /100 | #94 | Exceptional 93.6% |
| Immigrants | France | 99.0 /100 | #95 | Exceptional 93.6% |
| Immigrants | Turkey | 98.9 /100 | #96 | Exceptional 93.5% |
| Immigrants | Iran | 98.9 /100 | #97 | Exceptional 93.5% |
| Immigrants | Israel | 98.8 /100 | #98 | Exceptional 93.5% |
| Menominee | 98.7 /100 | #99 | Exceptional 93.5% |
| Immigrants | North Macedonia | 98.7 /100 | #100 | Exceptional 93.5% |
| Immigrants | Romania | 98.7 /100 | #101 | Exceptional 93.5% |
| Chippewa | 98.6 /100 | #102 | Exceptional 93.5% |
| Lebanese | 98.6 /100 | #103 | Exceptional 93.5% |
| Immigrants | Europe | 98.6 /100 | #104 | Exceptional 93.5% |