Assyrian/Chaldean/Syriac vs Immigrants from Latvia 11th Grade
COMPARE
Assyrian/Chaldean/Syriac
Immigrants from Latvia
11th Grade
11th Grade Comparison
Assyrians/Chaldeans/Syriacs
Immigrants from Latvia
92.8%
11TH GRADE
80.5/ 100
METRIC RATING
144th/ 347
METRIC RANK
93.8%
11TH GRADE
99.6/ 100
METRIC RATING
75th/ 347
METRIC RANK
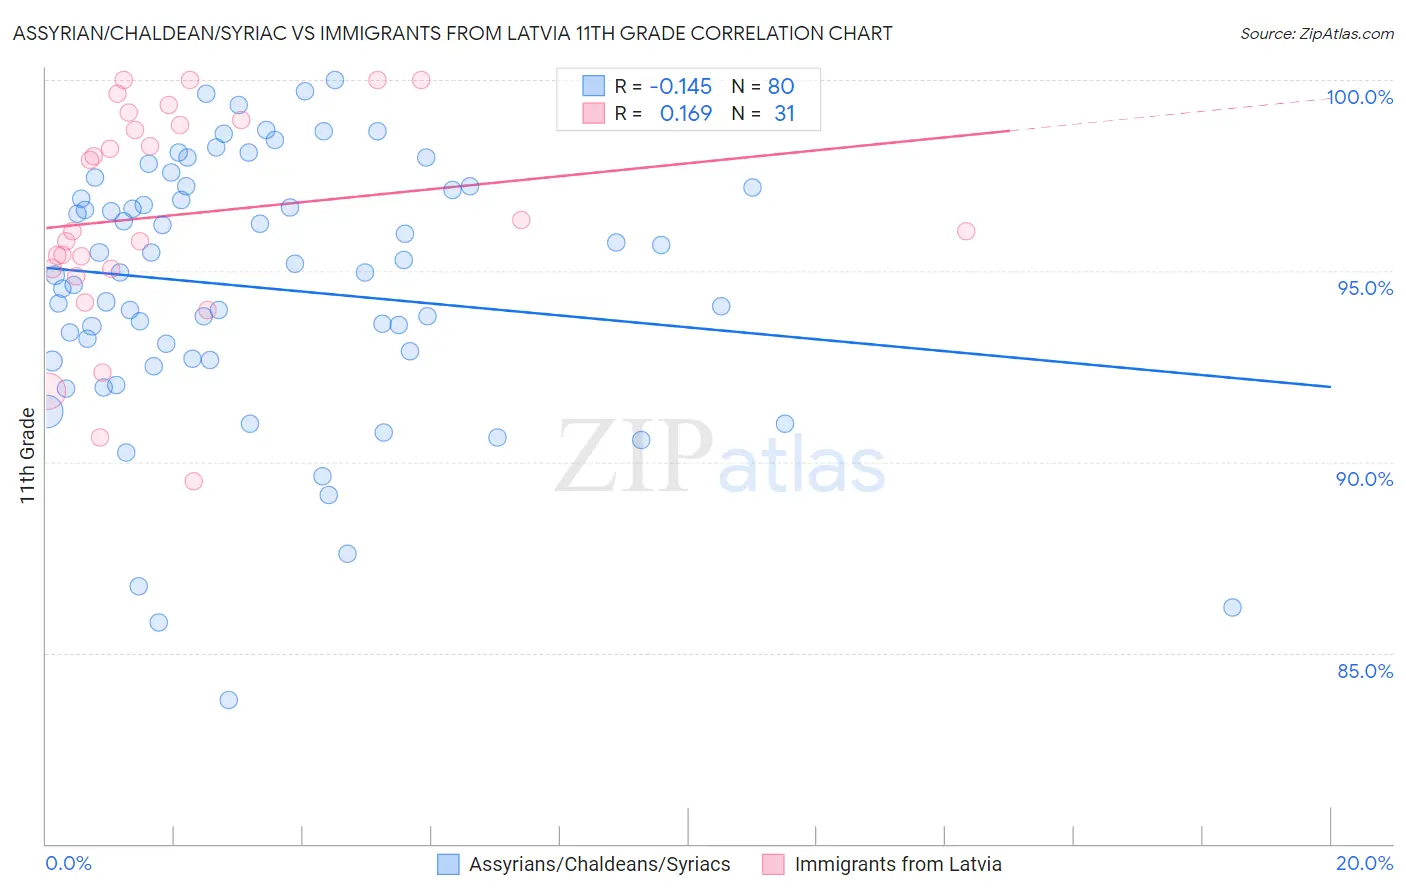
Assyrian/Chaldean/Syriac vs Immigrants from Latvia 11th Grade Correlation Chart
The statistical analysis conducted on geographies consisting of 110,318,125 people shows a poor negative correlation between the proportion of Assyrians/Chaldeans/Syriacs and percentage of population with at least 11th grade education in the United States with a correlation coefficient (R) of -0.145 and weighted average of 92.8%. Similarly, the statistical analysis conducted on geographies consisting of 113,735,345 people shows a poor positive correlation between the proportion of Immigrants from Latvia and percentage of population with at least 11th grade education in the United States with a correlation coefficient (R) of 0.169 and weighted average of 93.8%, a difference of 1.0%.
11th Grade Correlation Summary
| Measurement | Assyrian/Chaldean/Syriac | Immigrants from Latvia |
| Minimum | 83.8% | 89.5% |
| Maximum | 100.0% | 100.0% |
| Range | 16.2% | 10.5% |
| Mean | 94.6% | 96.5% |
| Median | 95.0% | 96.1% |
| Interquartile 25% (IQ1) | 92.7% | 95.1% |
| Interquartile 75% (IQ3) | 97.1% | 98.9% |
| Interquartile Range (IQR) | 4.5% | 3.9% |
| Standard Deviation (Sample) | 3.4% | 2.9% |
| Standard Deviation (Population) | 3.4% | 2.8% |
Similar Demographics by 11th Grade
Demographics Similar to Assyrians/Chaldeans/Syriacs by 11th Grade
In terms of 11th grade, the demographic groups most similar to Assyrians/Chaldeans/Syriacs are Pakistani (92.8%, a difference of 0.010%), Ugandan (92.9%, a difference of 0.020%), Iroquois (92.8%, a difference of 0.020%), Kenyan (92.9%, a difference of 0.030%), and Immigrants from Kenya (92.8%, a difference of 0.030%).
| Demographics | Rating | Rank | 11th Grade |
| Arabs | 85.4 /100 | #137 | Excellent 92.9% |
| Immigrants | Brazil | 85.1 /100 | #138 | Excellent 92.9% |
| Crow | 84.1 /100 | #139 | Excellent 92.9% |
| Venezuelans | 83.4 /100 | #140 | Excellent 92.9% |
| Chileans | 83.0 /100 | #141 | Excellent 92.9% |
| Kenyans | 82.0 /100 | #142 | Excellent 92.9% |
| Ugandans | 81.4 /100 | #143 | Excellent 92.9% |
| Assyrians/Chaldeans/Syriacs | 80.5 /100 | #144 | Excellent 92.8% |
| Pakistanis | 79.6 /100 | #145 | Good 92.8% |
| Iroquois | 79.1 /100 | #146 | Good 92.8% |
| Immigrants | Kenya | 78.7 /100 | #147 | Good 92.8% |
| Hmong | 78.6 /100 | #148 | Good 92.8% |
| Immigrants | Poland | 78.5 /100 | #149 | Good 92.8% |
| Immigrants | Egypt | 77.5 /100 | #150 | Good 92.8% |
| Potawatomi | 74.3 /100 | #151 | Good 92.8% |
Demographics Similar to Immigrants from Latvia by 11th Grade
In terms of 11th grade, the demographic groups most similar to Immigrants from Latvia are Romanian (93.8%, a difference of 0.020%), Immigrants from Czechoslovakia (93.8%, a difference of 0.020%), Celtic (93.7%, a difference of 0.030%), Aleut (93.7%, a difference of 0.030%), and Soviet Union (93.7%, a difference of 0.030%).
| Demographics | Rating | Rank | 11th Grade |
| Zimbabweans | 99.8 /100 | #68 | Exceptional 93.9% |
| Scotch-Irish | 99.8 /100 | #69 | Exceptional 93.9% |
| Immigrants | England | 99.7 /100 | #70 | Exceptional 93.8% |
| Immigrants | South Africa | 99.7 /100 | #71 | Exceptional 93.8% |
| Immigrants | Japan | 99.7 /100 | #72 | Exceptional 93.8% |
| Romanians | 99.6 /100 | #73 | Exceptional 93.8% |
| Immigrants | Czechoslovakia | 99.6 /100 | #74 | Exceptional 93.8% |
| Immigrants | Latvia | 99.6 /100 | #75 | Exceptional 93.8% |
| Celtics | 99.5 /100 | #76 | Exceptional 93.7% |
| Aleuts | 99.5 /100 | #77 | Exceptional 93.7% |
| Soviet Union | 99.5 /100 | #78 | Exceptional 93.7% |
| Immigrants | Denmark | 99.5 /100 | #79 | Exceptional 93.7% |
| Canadians | 99.5 /100 | #80 | Exceptional 93.7% |
| Immigrants | Moldova | 99.5 /100 | #81 | Exceptional 93.7% |
| Immigrants | Saudi Arabia | 99.3 /100 | #82 | Exceptional 93.7% |