Assyrian/Chaldean/Syriac vs Immigrants from Iran 3rd Grade
COMPARE
Assyrian/Chaldean/Syriac
Immigrants from Iran
3rd Grade
3rd Grade Comparison
Assyrians/Chaldeans/Syriacs
Immigrants from Iran
97.4%
3RD GRADE
1.0/ 100
METRIC RATING
247th/ 347
METRIC RANK
97.8%
3RD GRADE
59.1/ 100
METRIC RATING
160th/ 347
METRIC RANK
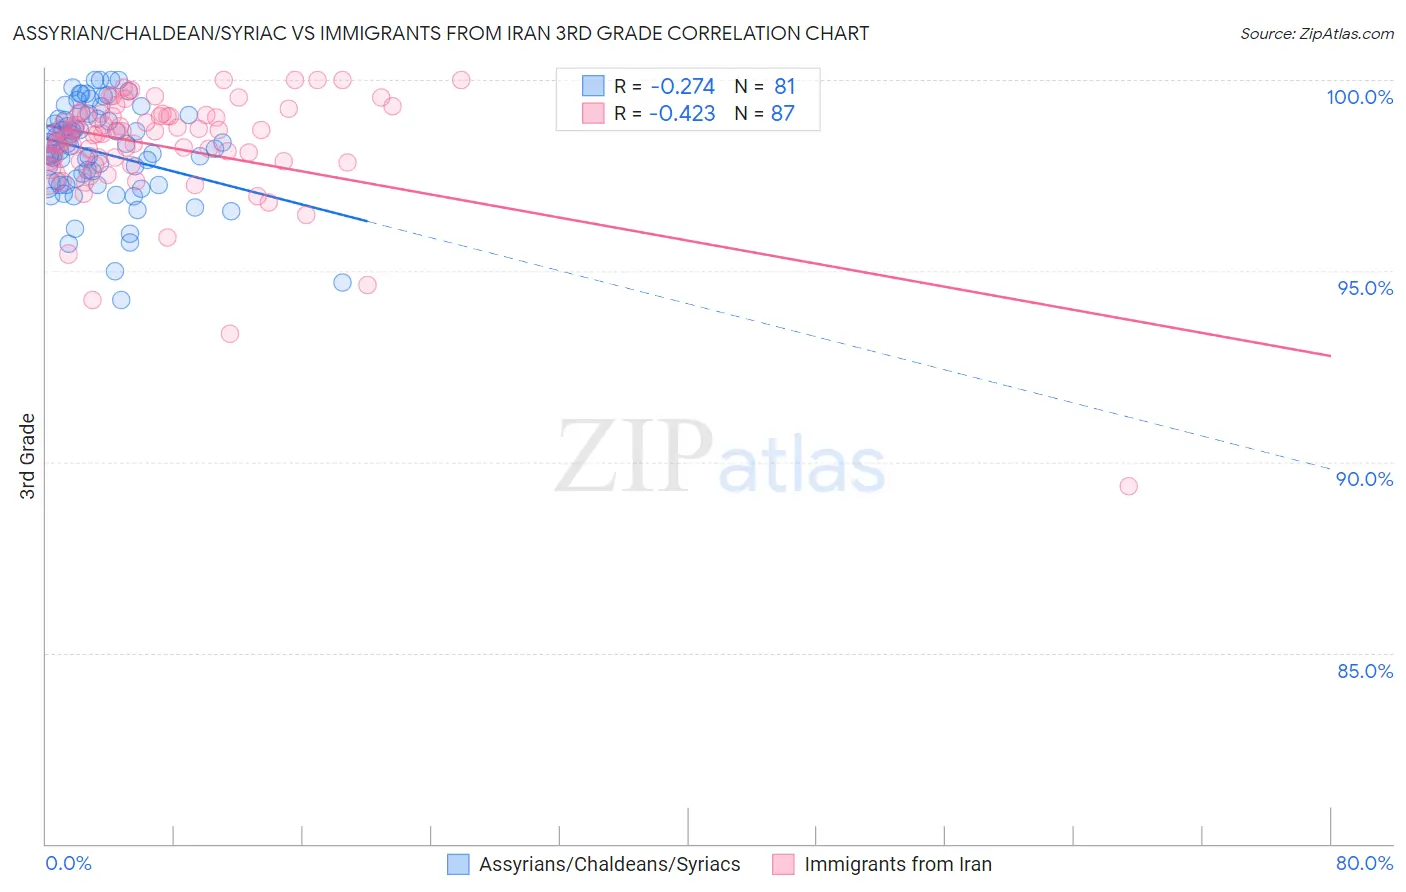
Assyrian/Chaldean/Syriac vs Immigrants from Iran 3rd Grade Correlation Chart
The statistical analysis conducted on geographies consisting of 110,318,304 people shows a weak negative correlation between the proportion of Assyrians/Chaldeans/Syriacs and percentage of population with at least 3rd grade education in the United States with a correlation coefficient (R) of -0.274 and weighted average of 97.4%. Similarly, the statistical analysis conducted on geographies consisting of 279,905,207 people shows a moderate negative correlation between the proportion of Immigrants from Iran and percentage of population with at least 3rd grade education in the United States with a correlation coefficient (R) of -0.423 and weighted average of 97.8%, a difference of 0.42%.
3rd Grade Correlation Summary
| Measurement | Assyrian/Chaldean/Syriac | Immigrants from Iran |
| Minimum | 94.2% | 89.4% |
| Maximum | 100.0% | 100.0% |
| Range | 5.8% | 10.6% |
| Mean | 98.1% | 98.3% |
| Median | 98.2% | 98.6% |
| Interquartile 25% (IQ1) | 97.3% | 97.9% |
| Interquartile 75% (IQ3) | 99.0% | 99.1% |
| Interquartile Range (IQR) | 1.7% | 1.2% |
| Standard Deviation (Sample) | 1.3% | 1.6% |
| Standard Deviation (Population) | 1.2% | 1.5% |
Similar Demographics by 3rd Grade
Demographics Similar to Assyrians/Chaldeans/Syriacs by 3rd Grade
In terms of 3rd grade, the demographic groups most similar to Assyrians/Chaldeans/Syriacs are Immigrants from Senegal (97.4%, a difference of 0.0%), Immigrants from Eastern Africa (97.4%, a difference of 0.0%), Asian (97.4%, a difference of 0.010%), Ethiopian (97.4%, a difference of 0.010%), and South American (97.4%, a difference of 0.010%).
| Demographics | Rating | Rank | 3rd Grade |
| U.S. Virgin Islanders | 1.4 /100 | #240 | Tragic 97.4% |
| Immigrants | Indonesia | 1.4 /100 | #241 | Tragic 97.4% |
| Koreans | 1.3 /100 | #242 | Tragic 97.4% |
| Indians (Asian) | 1.3 /100 | #243 | Tragic 97.4% |
| Asians | 1.1 /100 | #244 | Tragic 97.4% |
| Ethiopians | 1.1 /100 | #245 | Tragic 97.4% |
| Immigrants | Senegal | 1.0 /100 | #246 | Tragic 97.4% |
| Assyrians/Chaldeans/Syriacs | 1.0 /100 | #247 | Tragic 97.4% |
| Immigrants | Eastern Africa | 0.9 /100 | #248 | Tragic 97.4% |
| South Americans | 0.9 /100 | #249 | Tragic 97.4% |
| Immigrants | Middle Africa | 0.9 /100 | #250 | Tragic 97.4% |
| Immigrants | Asia | 0.8 /100 | #251 | Tragic 97.4% |
| Peruvians | 0.8 /100 | #252 | Tragic 97.4% |
| Immigrants | Africa | 0.8 /100 | #253 | Tragic 97.4% |
| Jamaicans | 0.7 /100 | #254 | Tragic 97.4% |
Demographics Similar to Immigrants from Iran by 3rd Grade
In terms of 3rd grade, the demographic groups most similar to Immigrants from Iran are French American Indian (97.8%, a difference of 0.0%), Albanian (97.8%, a difference of 0.0%), Immigrants from Jordan (97.8%, a difference of 0.0%), Bermudan (97.8%, a difference of 0.010%), and Immigrants from Russia (97.8%, a difference of 0.010%).
| Demographics | Rating | Rank | 3rd Grade |
| Apache | 68.5 /100 | #153 | Good 97.8% |
| Immigrants | Eastern Europe | 64.1 /100 | #154 | Good 97.8% |
| Bermudans | 62.6 /100 | #155 | Good 97.8% |
| Immigrants | Russia | 61.7 /100 | #156 | Good 97.8% |
| Immigrants | Italy | 61.2 /100 | #157 | Good 97.8% |
| Venezuelans | 60.9 /100 | #158 | Good 97.8% |
| French American Indians | 60.0 /100 | #159 | Average 97.8% |
| Immigrants | Iran | 59.1 /100 | #160 | Average 97.8% |
| Albanians | 58.8 /100 | #161 | Average 97.8% |
| Immigrants | Jordan | 57.9 /100 | #162 | Average 97.8% |
| Marshallese | 57.2 /100 | #163 | Average 97.8% |
| Immigrants | Bosnia and Herzegovina | 56.2 /100 | #164 | Average 97.8% |
| Ugandans | 56.1 /100 | #165 | Average 97.8% |
| Dutch West Indians | 55.5 /100 | #166 | Average 97.8% |
| Chileans | 55.3 /100 | #167 | Average 97.8% |