Asian vs Thai No Schooling Completed
COMPARE
Asian
Thai
No Schooling Completed
No Schooling Completed Comparison
Asians
Thais
2.4%
NO SCHOOLING COMPLETED
1.2/ 100
METRIC RATING
248th/ 347
METRIC RANK
1.8%
NO SCHOOLING COMPLETED
97.5/ 100
METRIC RATING
104th/ 347
METRIC RANK
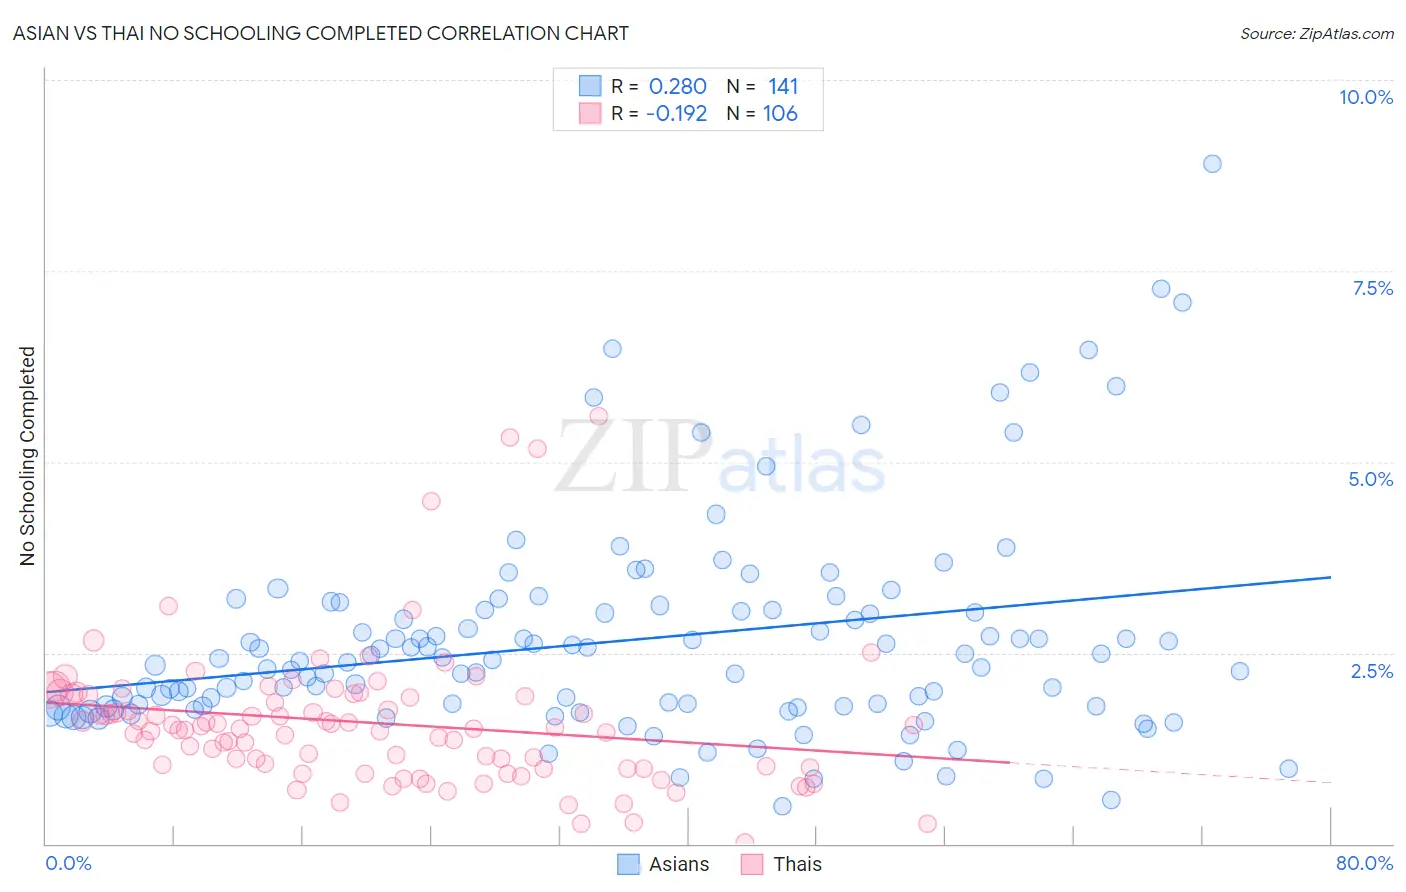
Asian vs Thai No Schooling Completed Correlation Chart
The statistical analysis conducted on geographies consisting of 537,405,383 people shows a weak positive correlation between the proportion of Asians and percentage of population with no schooling in the United States with a correlation coefficient (R) of 0.280 and weighted average of 2.4%. Similarly, the statistical analysis conducted on geographies consisting of 469,412,663 people shows a poor negative correlation between the proportion of Thais and percentage of population with no schooling in the United States with a correlation coefficient (R) of -0.192 and weighted average of 1.8%, a difference of 30.9%.
No Schooling Completed Correlation Summary
| Measurement | Asian | Thai |
| Minimum | 0.49% | 0.015% |
| Maximum | 8.9% | 5.6% |
| Range | 8.4% | 5.6% |
| Mean | 2.7% | 1.6% |
| Median | 2.4% | 1.5% |
| Interquartile 25% (IQ1) | 1.8% | 1.0% |
| Interquartile 75% (IQ3) | 3.1% | 2.0% |
| Interquartile Range (IQR) | 1.3% | 0.95% |
| Standard Deviation (Sample) | 1.4% | 0.92% |
| Standard Deviation (Population) | 1.4% | 0.92% |
Similar Demographics by No Schooling Completed
Demographics Similar to Asians by No Schooling Completed
In terms of no schooling completed, the demographic groups most similar to Asians are Jamaican (2.4%, a difference of 0.19%), Immigrants from Middle Africa (2.4%, a difference of 0.24%), Immigrants from Africa (2.4%, a difference of 0.25%), Immigrants from Iraq (2.4%, a difference of 0.27%), and Immigrants from Congo (2.4%, a difference of 0.37%).
| Demographics | Rating | Rank | No Schooling Completed |
| Koreans | 1.7 /100 | #241 | Tragic 2.4% |
| Immigrants | Indonesia | 1.5 /100 | #242 | Tragic 2.4% |
| South Americans | 1.5 /100 | #243 | Tragic 2.4% |
| Peruvians | 1.4 /100 | #244 | Tragic 2.4% |
| Bolivians | 1.4 /100 | #245 | Tragic 2.4% |
| Immigrants | Congo | 1.4 /100 | #246 | Tragic 2.4% |
| Immigrants | Iraq | 1.3 /100 | #247 | Tragic 2.4% |
| Asians | 1.2 /100 | #248 | Tragic 2.4% |
| Jamaicans | 1.2 /100 | #249 | Tragic 2.4% |
| Immigrants | Middle Africa | 1.1 /100 | #250 | Tragic 2.4% |
| Immigrants | Africa | 1.1 /100 | #251 | Tragic 2.4% |
| Immigrants | Colombia | 1.0 /100 | #252 | Tragic 2.4% |
| Immigrants | Asia | 0.9 /100 | #253 | Tragic 2.4% |
| Immigrants | Eastern Africa | 0.9 /100 | #254 | Tragic 2.4% |
| Ethiopians | 0.8 /100 | #255 | Tragic 2.4% |
Demographics Similar to Thais by No Schooling Completed
In terms of no schooling completed, the demographic groups most similar to Thais are German Russian (1.8%, a difference of 0.020%), Immigrants from France (1.8%, a difference of 0.42%), Yugoslavian (1.8%, a difference of 0.46%), Basque (1.8%, a difference of 0.57%), and Immigrants from Czechoslovakia (1.8%, a difference of 0.63%).
| Demographics | Rating | Rank | No Schooling Completed |
| Immigrants | Ireland | 98.4 /100 | #97 | Exceptional 1.8% |
| Iranians | 98.2 /100 | #98 | Exceptional 1.8% |
| Choctaw | 98.1 /100 | #99 | Exceptional 1.8% |
| Immigrants | Singapore | 98.0 /100 | #100 | Exceptional 1.8% |
| Immigrants | Czechoslovakia | 97.9 /100 | #101 | Exceptional 1.8% |
| Immigrants | Switzerland | 97.9 /100 | #102 | Exceptional 1.8% |
| Basques | 97.9 /100 | #103 | Exceptional 1.8% |
| Thais | 97.5 /100 | #104 | Exceptional 1.8% |
| German Russians | 97.5 /100 | #105 | Exceptional 1.8% |
| Immigrants | France | 97.3 /100 | #106 | Exceptional 1.8% |
| Yugoslavians | 97.2 /100 | #107 | Exceptional 1.8% |
| Okinawans | 97.1 /100 | #108 | Exceptional 1.8% |
| Immigrants | Saudi Arabia | 96.8 /100 | #109 | Exceptional 1.9% |
| Immigrants | Latvia | 96.7 /100 | #110 | Exceptional 1.9% |
| Immigrants | Japan | 96.6 /100 | #111 | Exceptional 1.9% |