Asian vs Immigrants from Bulgaria No Schooling Completed
COMPARE
Asian
Immigrants from Bulgaria
No Schooling Completed
No Schooling Completed Comparison
Asians
Immigrants from Bulgaria
2.4%
NO SCHOOLING COMPLETED
1.2/ 100
METRIC RATING
248th/ 347
METRIC RANK
1.9%
NO SCHOOLING COMPLETED
94.6/ 100
METRIC RATING
120th/ 347
METRIC RANK
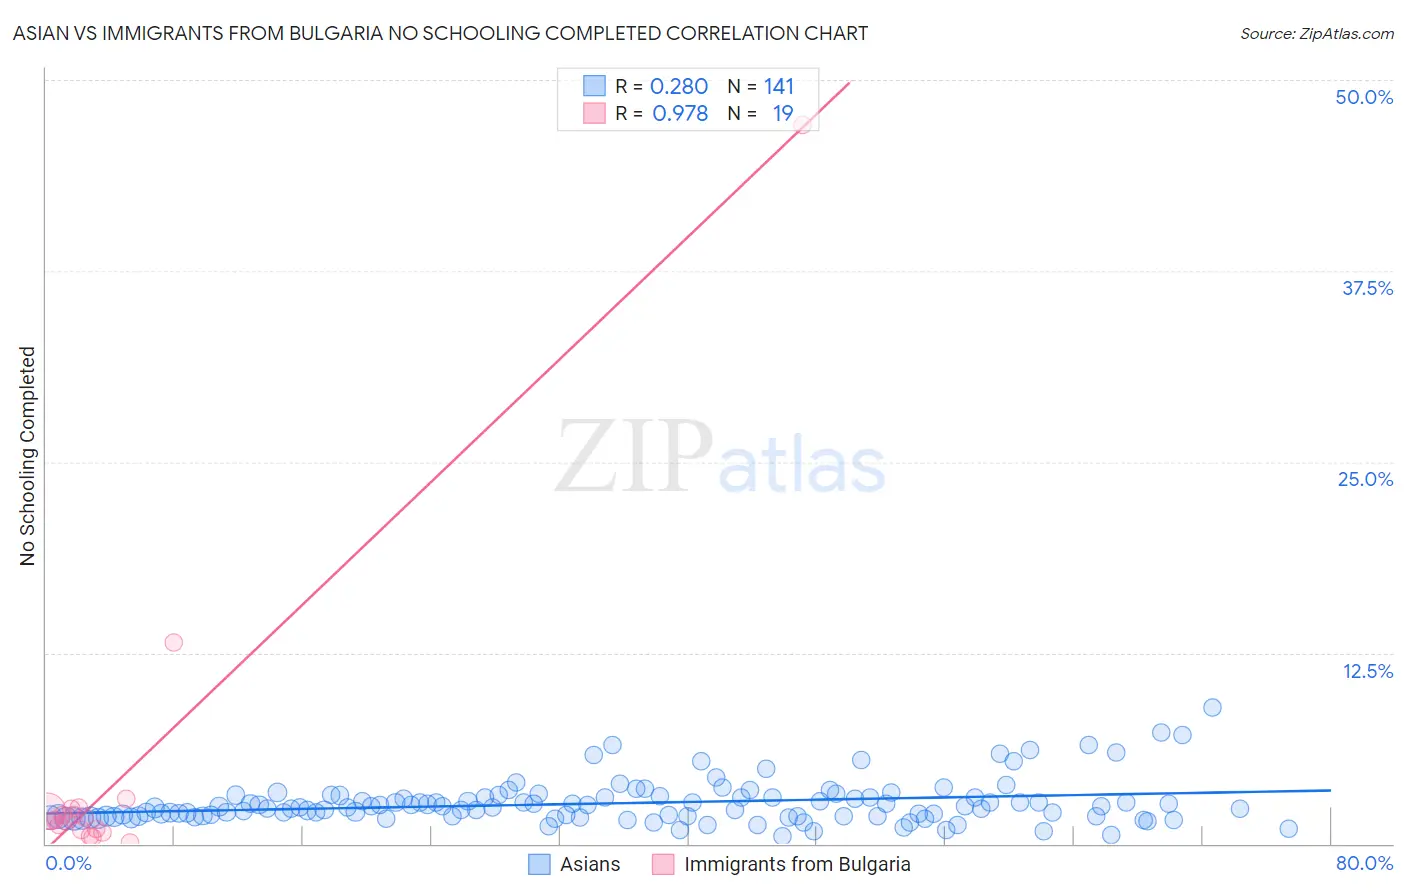
Asian vs Immigrants from Bulgaria No Schooling Completed Correlation Chart
The statistical analysis conducted on geographies consisting of 537,405,383 people shows a weak positive correlation between the proportion of Asians and percentage of population with no schooling in the United States with a correlation coefficient (R) of 0.280 and weighted average of 2.4%. Similarly, the statistical analysis conducted on geographies consisting of 171,926,286 people shows a perfect positive correlation between the proportion of Immigrants from Bulgaria and percentage of population with no schooling in the United States with a correlation coefficient (R) of 0.978 and weighted average of 1.9%, a difference of 26.9%.
No Schooling Completed Correlation Summary
| Measurement | Asian | Immigrants from Bulgaria |
| Minimum | 0.49% | 0.085% |
| Maximum | 8.9% | 47.1% |
| Range | 8.4% | 47.0% |
| Mean | 2.7% | 4.5% |
| Median | 2.4% | 1.5% |
| Interquartile 25% (IQ1) | 1.8% | 0.90% |
| Interquartile 75% (IQ3) | 3.1% | 2.3% |
| Interquartile Range (IQR) | 1.3% | 1.4% |
| Standard Deviation (Sample) | 1.4% | 10.7% |
| Standard Deviation (Population) | 1.4% | 10.4% |
Similar Demographics by No Schooling Completed
Demographics Similar to Asians by No Schooling Completed
In terms of no schooling completed, the demographic groups most similar to Asians are Jamaican (2.4%, a difference of 0.19%), Immigrants from Middle Africa (2.4%, a difference of 0.24%), Immigrants from Africa (2.4%, a difference of 0.25%), Immigrants from Iraq (2.4%, a difference of 0.27%), and Immigrants from Congo (2.4%, a difference of 0.37%).
| Demographics | Rating | Rank | No Schooling Completed |
| Koreans | 1.7 /100 | #241 | Tragic 2.4% |
| Immigrants | Indonesia | 1.5 /100 | #242 | Tragic 2.4% |
| South Americans | 1.5 /100 | #243 | Tragic 2.4% |
| Peruvians | 1.4 /100 | #244 | Tragic 2.4% |
| Bolivians | 1.4 /100 | #245 | Tragic 2.4% |
| Immigrants | Congo | 1.4 /100 | #246 | Tragic 2.4% |
| Immigrants | Iraq | 1.3 /100 | #247 | Tragic 2.4% |
| Asians | 1.2 /100 | #248 | Tragic 2.4% |
| Jamaicans | 1.2 /100 | #249 | Tragic 2.4% |
| Immigrants | Middle Africa | 1.1 /100 | #250 | Tragic 2.4% |
| Immigrants | Africa | 1.1 /100 | #251 | Tragic 2.4% |
| Immigrants | Colombia | 1.0 /100 | #252 | Tragic 2.4% |
| Immigrants | Asia | 0.9 /100 | #253 | Tragic 2.4% |
| Immigrants | Eastern Africa | 0.9 /100 | #254 | Tragic 2.4% |
| Ethiopians | 0.8 /100 | #255 | Tragic 2.4% |
Demographics Similar to Immigrants from Bulgaria by No Schooling Completed
In terms of no schooling completed, the demographic groups most similar to Immigrants from Bulgaria are Immigrants from Croatia (1.9%, a difference of 0.060%), Cree (1.9%, a difference of 0.090%), Iroquois (1.9%, a difference of 0.40%), Immigrants from Kuwait (1.9%, a difference of 0.46%), and Cambodian (1.9%, a difference of 0.53%).
| Demographics | Rating | Rank | No Schooling Completed |
| Immigrants | Zimbabwe | 96.2 /100 | #113 | Exceptional 1.9% |
| Immigrants | Norway | 96.1 /100 | #114 | Exceptional 1.9% |
| Syrians | 96.0 /100 | #115 | Exceptional 1.9% |
| Lebanese | 96.0 /100 | #116 | Exceptional 1.9% |
| Immigrants | Serbia | 95.8 /100 | #117 | Exceptional 1.9% |
| Spanish | 95.5 /100 | #118 | Exceptional 1.9% |
| Iroquois | 95.1 /100 | #119 | Exceptional 1.9% |
| Immigrants | Bulgaria | 94.6 /100 | #120 | Exceptional 1.9% |
| Immigrants | Croatia | 94.5 /100 | #121 | Exceptional 1.9% |
| Cree | 94.5 /100 | #122 | Exceptional 1.9% |
| Immigrants | Kuwait | 93.9 /100 | #123 | Exceptional 1.9% |
| Cambodians | 93.8 /100 | #124 | Exceptional 1.9% |
| Immigrants | Europe | 93.7 /100 | #125 | Exceptional 1.9% |
| Immigrants | Romania | 92.6 /100 | #126 | Exceptional 1.9% |
| Israelis | 92.4 /100 | #127 | Exceptional 1.9% |