Immigrants from Canada vs Pennsylvania German Associate's Degree
COMPARE
Immigrants from Canada
Pennsylvania German
Associate's Degree
Associate's Degree Comparison
Immigrants from Canada
Pennsylvania Germans
50.1%
ASSOCIATE'S DEGREE
98.7/ 100
METRIC RATING
88th/ 347
METRIC RANK
37.2%
ASSOCIATE'S DEGREE
0.0/ 100
METRIC RATING
322nd/ 347
METRIC RANK
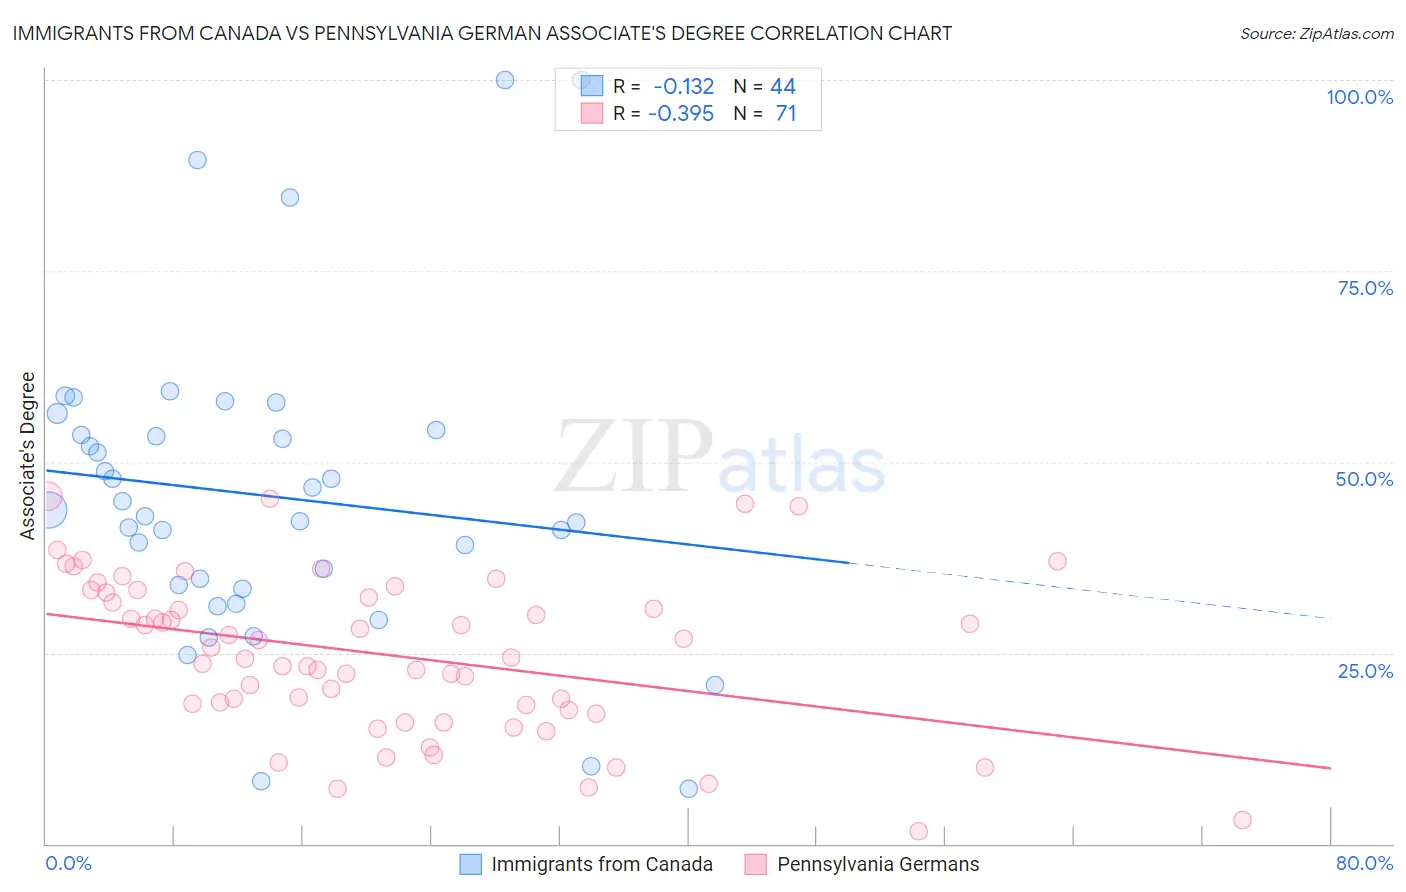
Immigrants from Canada vs Pennsylvania German Associate's Degree Correlation Chart
The statistical analysis conducted on geographies consisting of 459,369,326 people shows a poor negative correlation between the proportion of Immigrants from Canada and percentage of population with at least associate's degree education in the United States with a correlation coefficient (R) of -0.132 and weighted average of 50.1%. Similarly, the statistical analysis conducted on geographies consisting of 234,093,670 people shows a mild negative correlation between the proportion of Pennsylvania Germans and percentage of population with at least associate's degree education in the United States with a correlation coefficient (R) of -0.395 and weighted average of 37.2%, a difference of 34.7%.
Associate's Degree Correlation Summary
| Measurement | Immigrants from Canada | Pennsylvania German |
| Minimum | 7.1% | 1.6% |
| Maximum | 100.0% | 45.5% |
| Range | 92.9% | 44.0% |
| Mean | 45.5% | 24.7% |
| Median | 43.3% | 24.4% |
| Interquartile 25% (IQ1) | 33.6% | 17.5% |
| Interquartile 75% (IQ3) | 53.9% | 32.9% |
| Interquartile Range (IQR) | 20.3% | 15.3% |
| Standard Deviation (Sample) | 20.4% | 10.3% |
| Standard Deviation (Population) | 20.2% | 10.2% |
Similar Demographics by Associate's Degree
Demographics Similar to Immigrants from Canada by Associate's Degree
In terms of associate's degree, the demographic groups most similar to Immigrants from Canada are Immigrants from Western Europe (50.1%, a difference of 0.010%), Immigrants from Ethiopia (50.1%, a difference of 0.010%), Immigrants from Moldova (50.2%, a difference of 0.070%), Immigrants from Western Asia (50.1%, a difference of 0.090%), and Immigrants from North America (50.1%, a difference of 0.11%).
| Demographics | Rating | Rank | Associate's Degree |
| Maltese | 99.1 /100 | #81 | Exceptional 50.4% |
| Greeks | 98.9 /100 | #82 | Exceptional 50.3% |
| Immigrants | Uzbekistan | 98.9 /100 | #83 | Exceptional 50.3% |
| Immigrants | Hungary | 98.9 /100 | #84 | Exceptional 50.2% |
| Immigrants | Egypt | 98.9 /100 | #85 | Exceptional 50.2% |
| Immigrants | Croatia | 98.9 /100 | #86 | Exceptional 50.2% |
| Immigrants | Moldova | 98.8 /100 | #87 | Exceptional 50.2% |
| Immigrants | Canada | 98.7 /100 | #88 | Exceptional 50.1% |
| Immigrants | Western Europe | 98.7 /100 | #89 | Exceptional 50.1% |
| Immigrants | Ethiopia | 98.7 /100 | #90 | Exceptional 50.1% |
| Immigrants | Western Asia | 98.7 /100 | #91 | Exceptional 50.1% |
| Immigrants | North America | 98.7 /100 | #92 | Exceptional 50.1% |
| Immigrants | Brazil | 98.5 /100 | #93 | Exceptional 50.0% |
| Laotians | 98.4 /100 | #94 | Exceptional 49.9% |
| Immigrants | England | 98.0 /100 | #95 | Exceptional 49.7% |
Demographics Similar to Pennsylvania Germans by Associate's Degree
In terms of associate's degree, the demographic groups most similar to Pennsylvania Germans are Immigrants from Yemen (37.3%, a difference of 0.29%), Cajun (37.4%, a difference of 0.40%), Fijian (37.4%, a difference of 0.43%), Alaska Native (37.5%, a difference of 0.66%), and Yaqui (37.6%, a difference of 0.89%).
| Demographics | Rating | Rank | Associate's Degree |
| Creek | 0.0 /100 | #315 | Tragic 37.6% |
| Crow | 0.0 /100 | #316 | Tragic 37.6% |
| Yaqui | 0.0 /100 | #317 | Tragic 37.6% |
| Alaska Natives | 0.0 /100 | #318 | Tragic 37.5% |
| Fijians | 0.0 /100 | #319 | Tragic 37.4% |
| Cajuns | 0.0 /100 | #320 | Tragic 37.4% |
| Immigrants | Yemen | 0.0 /100 | #321 | Tragic 37.3% |
| Pennsylvania Germans | 0.0 /100 | #322 | Tragic 37.2% |
| Immigrants | Cabo Verde | 0.0 /100 | #323 | Tragic 36.8% |
| Arapaho | 0.0 /100 | #324 | Tragic 36.7% |
| Menominee | 0.0 /100 | #325 | Tragic 36.7% |
| Kiowa | 0.0 /100 | #326 | Tragic 36.5% |
| Dutch West Indians | 0.0 /100 | #327 | Tragic 36.5% |
| Alaskan Athabascans | 0.0 /100 | #328 | Tragic 36.5% |
| Paiute | 0.0 /100 | #329 | Tragic 36.4% |