Immigrants from Laos vs Macedonian Associate's Degree
COMPARE
Immigrants from Laos
Macedonian
Associate's Degree
Associate's Degree Comparison
Immigrants from Laos
Macedonians
40.7%
ASSOCIATE'S DEGREE
0.1/ 100
METRIC RATING
271st/ 347
METRIC RANK
49.6%
ASSOCIATE'S DEGREE
97.8/ 100
METRIC RATING
99th/ 347
METRIC RANK
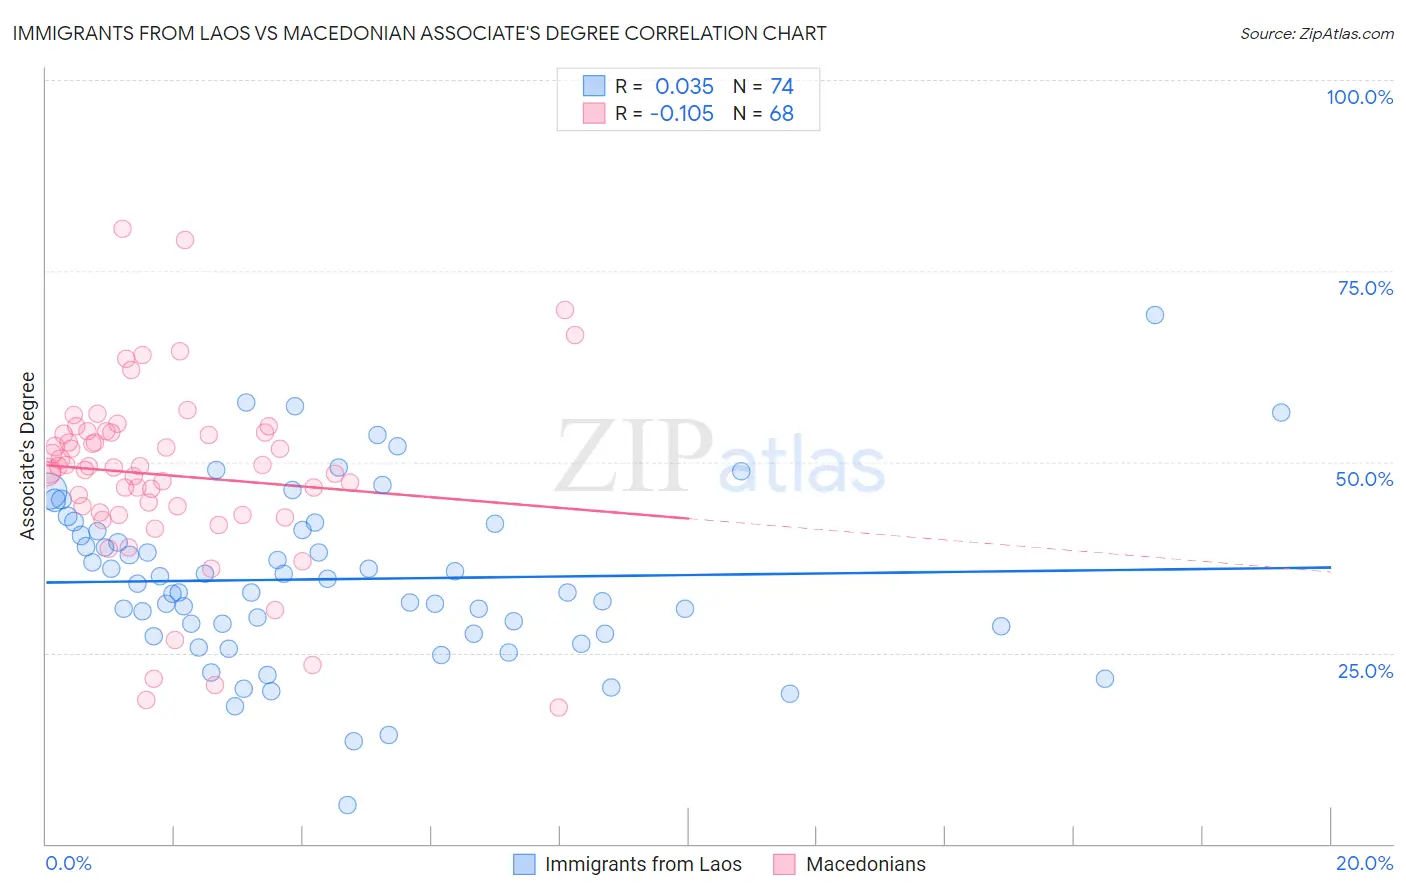
Immigrants from Laos vs Macedonian Associate's Degree Correlation Chart
The statistical analysis conducted on geographies consisting of 201,474,630 people shows no correlation between the proportion of Immigrants from Laos and percentage of population with at least associate's degree education in the United States with a correlation coefficient (R) of 0.035 and weighted average of 40.7%. Similarly, the statistical analysis conducted on geographies consisting of 132,656,097 people shows a poor negative correlation between the proportion of Macedonians and percentage of population with at least associate's degree education in the United States with a correlation coefficient (R) of -0.105 and weighted average of 49.6%, a difference of 22.1%.
Associate's Degree Correlation Summary
| Measurement | Immigrants from Laos | Macedonian |
| Minimum | 5.0% | 17.8% |
| Maximum | 69.3% | 80.6% |
| Range | 64.3% | 62.7% |
| Mean | 34.7% | 48.2% |
| Median | 33.4% | 49.4% |
| Interquartile 25% (IQ1) | 27.5% | 43.2% |
| Interquartile 75% (IQ3) | 41.0% | 53.9% |
| Interquartile Range (IQR) | 13.5% | 10.6% |
| Standard Deviation (Sample) | 11.3% | 12.1% |
| Standard Deviation (Population) | 11.2% | 12.0% |
Similar Demographics by Associate's Degree
Demographics Similar to Immigrants from Laos by Associate's Degree
In terms of associate's degree, the demographic groups most similar to Immigrants from Laos are Belizean (40.6%, a difference of 0.070%), Chippewa (40.7%, a difference of 0.18%), American (40.8%, a difference of 0.23%), Puget Sound Salish (40.5%, a difference of 0.36%), and Central American Indian (40.8%, a difference of 0.41%).
| Demographics | Rating | Rank | Associate's Degree |
| Osage | 0.3 /100 | #264 | Tragic 41.5% |
| Africans | 0.2 /100 | #265 | Tragic 41.1% |
| Samoans | 0.2 /100 | #266 | Tragic 41.1% |
| Hawaiians | 0.2 /100 | #267 | Tragic 40.9% |
| Central American Indians | 0.2 /100 | #268 | Tragic 40.8% |
| Americans | 0.2 /100 | #269 | Tragic 40.8% |
| Chippewa | 0.2 /100 | #270 | Tragic 40.7% |
| Immigrants | Laos | 0.1 /100 | #271 | Tragic 40.7% |
| Belizeans | 0.1 /100 | #272 | Tragic 40.6% |
| Puget Sound Salish | 0.1 /100 | #273 | Tragic 40.5% |
| Immigrants | Dominica | 0.1 /100 | #274 | Tragic 40.5% |
| Potawatomi | 0.1 /100 | #275 | Tragic 40.4% |
| Puerto Ricans | 0.1 /100 | #276 | Tragic 40.4% |
| Blackfeet | 0.1 /100 | #277 | Tragic 40.3% |
| Ottawa | 0.1 /100 | #278 | Tragic 40.3% |
Demographics Similar to Macedonians by Associate's Degree
In terms of associate's degree, the demographic groups most similar to Macedonians are Immigrants from Northern Africa (49.7%, a difference of 0.070%), Romanian (49.7%, a difference of 0.16%), Immigrants from Ukraine (49.7%, a difference of 0.16%), Immigrants from England (49.7%, a difference of 0.18%), and Immigrants from Nepal (49.5%, a difference of 0.22%).
| Demographics | Rating | Rank | Associate's Degree |
| Immigrants | North America | 98.7 /100 | #92 | Exceptional 50.1% |
| Immigrants | Brazil | 98.5 /100 | #93 | Exceptional 50.0% |
| Laotians | 98.4 /100 | #94 | Exceptional 49.9% |
| Immigrants | England | 98.0 /100 | #95 | Exceptional 49.7% |
| Romanians | 98.0 /100 | #96 | Exceptional 49.7% |
| Immigrants | Ukraine | 98.0 /100 | #97 | Exceptional 49.7% |
| Immigrants | Northern Africa | 97.9 /100 | #98 | Exceptional 49.7% |
| Macedonians | 97.8 /100 | #99 | Exceptional 49.6% |
| Immigrants | Nepal | 97.5 /100 | #100 | Exceptional 49.5% |
| Northern Europeans | 97.3 /100 | #101 | Exceptional 49.5% |
| Chileans | 97.3 /100 | #102 | Exceptional 49.4% |
| Ukrainians | 97.1 /100 | #103 | Exceptional 49.4% |
| Venezuelans | 97.0 /100 | #104 | Exceptional 49.4% |
| Croatians | 96.8 /100 | #105 | Exceptional 49.3% |
| Immigrants | Italy | 96.7 /100 | #106 | Exceptional 49.3% |