Immigrants from Nigeria vs Macedonian Associate's Degree
COMPARE
Immigrants from Nigeria
Macedonian
Associate's Degree
Associate's Degree Comparison
Immigrants from Nigeria
Macedonians
44.6%
ASSOCIATE'S DEGREE
11.4/ 100
METRIC RATING
216th/ 347
METRIC RANK
49.6%
ASSOCIATE'S DEGREE
97.8/ 100
METRIC RATING
99th/ 347
METRIC RANK
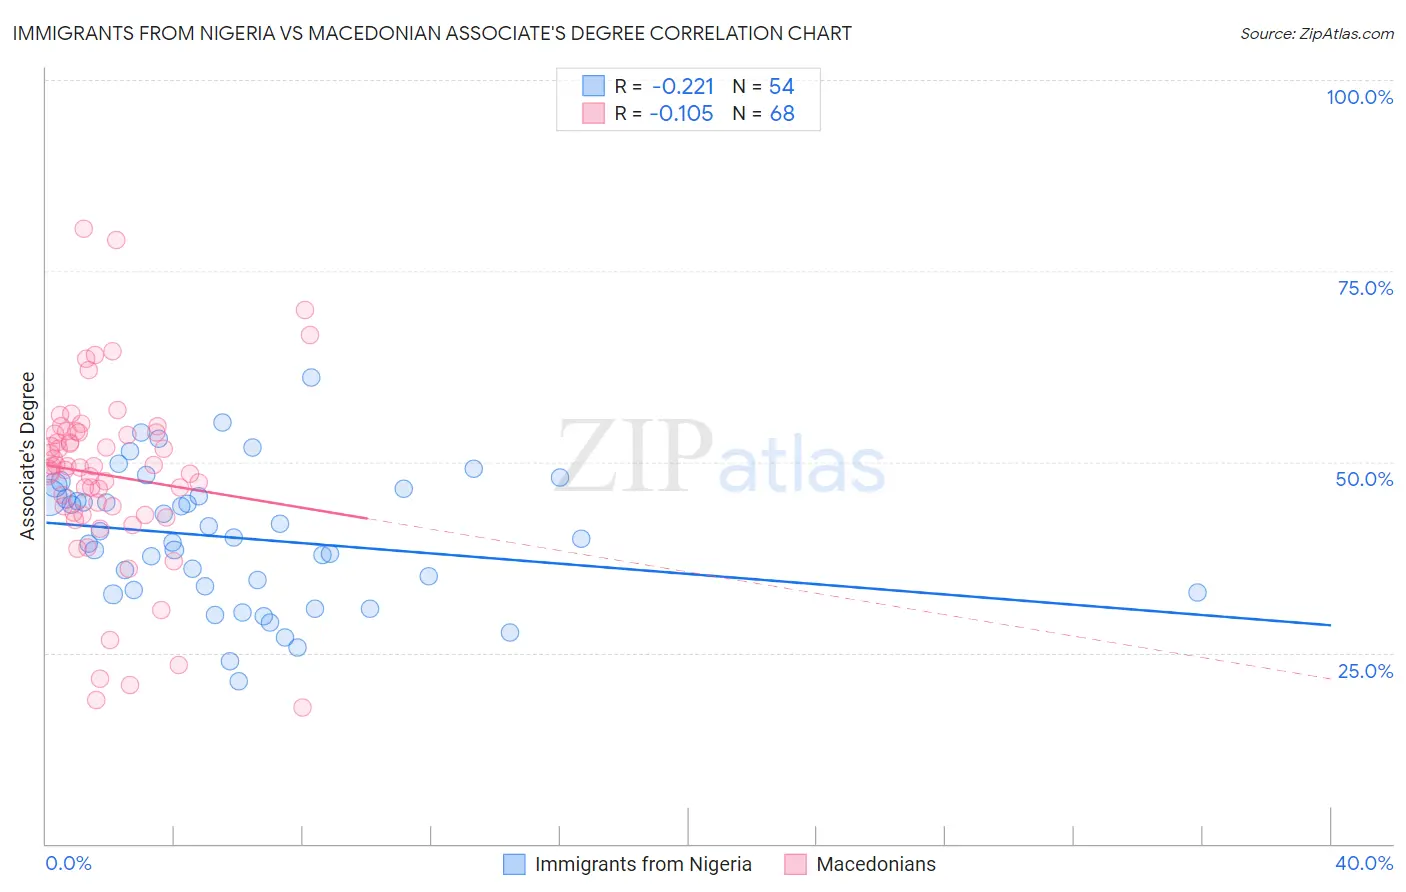
Immigrants from Nigeria vs Macedonian Associate's Degree Correlation Chart
The statistical analysis conducted on geographies consisting of 283,469,524 people shows a weak negative correlation between the proportion of Immigrants from Nigeria and percentage of population with at least associate's degree education in the United States with a correlation coefficient (R) of -0.221 and weighted average of 44.6%. Similarly, the statistical analysis conducted on geographies consisting of 132,656,097 people shows a poor negative correlation between the proportion of Macedonians and percentage of population with at least associate's degree education in the United States with a correlation coefficient (R) of -0.105 and weighted average of 49.6%, a difference of 11.4%.
Associate's Degree Correlation Summary
| Measurement | Immigrants from Nigeria | Macedonian |
| Minimum | 21.3% | 17.8% |
| Maximum | 61.1% | 80.6% |
| Range | 39.8% | 62.7% |
| Mean | 40.0% | 48.2% |
| Median | 40.0% | 49.4% |
| Interquartile 25% (IQ1) | 33.2% | 43.2% |
| Interquartile 75% (IQ3) | 45.5% | 53.9% |
| Interquartile Range (IQR) | 12.3% | 10.6% |
| Standard Deviation (Sample) | 8.7% | 12.1% |
| Standard Deviation (Population) | 8.6% | 12.0% |
Similar Demographics by Associate's Degree
Demographics Similar to Immigrants from Nigeria by Associate's Degree
In terms of associate's degree, the demographic groups most similar to Immigrants from Nigeria are Immigrants from Panama (44.7%, a difference of 0.18%), Immigrants (44.5%, a difference of 0.19%), Immigrants from Middle Africa (44.7%, a difference of 0.24%), Spanish (44.4%, a difference of 0.43%), and Immigrants from Ghana (44.8%, a difference of 0.49%).
| Demographics | Rating | Rank | Associate's Degree |
| Immigrants | Costa Rica | 16.7 /100 | #209 | Poor 45.0% |
| Immigrants | Philippines | 16.7 /100 | #210 | Poor 45.0% |
| Immigrants | Zaire | 16.6 /100 | #211 | Poor 45.0% |
| French Canadians | 15.0 /100 | #212 | Poor 44.9% |
| Immigrants | Ghana | 14.2 /100 | #213 | Poor 44.8% |
| Immigrants | Middle Africa | 12.7 /100 | #214 | Poor 44.7% |
| Immigrants | Panama | 12.4 /100 | #215 | Poor 44.7% |
| Immigrants | Nigeria | 11.4 /100 | #216 | Poor 44.6% |
| Immigrants | Immigrants | 10.5 /100 | #217 | Poor 44.5% |
| Spanish | 9.4 /100 | #218 | Tragic 44.4% |
| Whites/Caucasians | 7.5 /100 | #219 | Tragic 44.2% |
| Portuguese | 7.2 /100 | #220 | Tragic 44.1% |
| Immigrants | Western Africa | 6.6 /100 | #221 | Tragic 44.1% |
| Barbadians | 5.8 /100 | #222 | Tragic 43.9% |
| Sub-Saharan Africans | 5.5 /100 | #223 | Tragic 43.9% |
Demographics Similar to Macedonians by Associate's Degree
In terms of associate's degree, the demographic groups most similar to Macedonians are Immigrants from Northern Africa (49.7%, a difference of 0.070%), Romanian (49.7%, a difference of 0.16%), Immigrants from Ukraine (49.7%, a difference of 0.16%), Immigrants from England (49.7%, a difference of 0.18%), and Immigrants from Nepal (49.5%, a difference of 0.22%).
| Demographics | Rating | Rank | Associate's Degree |
| Immigrants | North America | 98.7 /100 | #92 | Exceptional 50.1% |
| Immigrants | Brazil | 98.5 /100 | #93 | Exceptional 50.0% |
| Laotians | 98.4 /100 | #94 | Exceptional 49.9% |
| Immigrants | England | 98.0 /100 | #95 | Exceptional 49.7% |
| Romanians | 98.0 /100 | #96 | Exceptional 49.7% |
| Immigrants | Ukraine | 98.0 /100 | #97 | Exceptional 49.7% |
| Immigrants | Northern Africa | 97.9 /100 | #98 | Exceptional 49.7% |
| Macedonians | 97.8 /100 | #99 | Exceptional 49.6% |
| Immigrants | Nepal | 97.5 /100 | #100 | Exceptional 49.5% |
| Northern Europeans | 97.3 /100 | #101 | Exceptional 49.5% |
| Chileans | 97.3 /100 | #102 | Exceptional 49.4% |
| Ukrainians | 97.1 /100 | #103 | Exceptional 49.4% |
| Venezuelans | 97.0 /100 | #104 | Exceptional 49.4% |
| Croatians | 96.8 /100 | #105 | Exceptional 49.3% |
| Immigrants | Italy | 96.7 /100 | #106 | Exceptional 49.3% |