Bulgarian vs Macedonian Associate's Degree
COMPARE
Bulgarian
Macedonian
Associate's Degree
Associate's Degree Comparison
Bulgarians
Macedonians
53.3%
ASSOCIATE'S DEGREE
100.0/ 100
METRIC RATING
34th/ 347
METRIC RANK
49.6%
ASSOCIATE'S DEGREE
97.8/ 100
METRIC RATING
99th/ 347
METRIC RANK
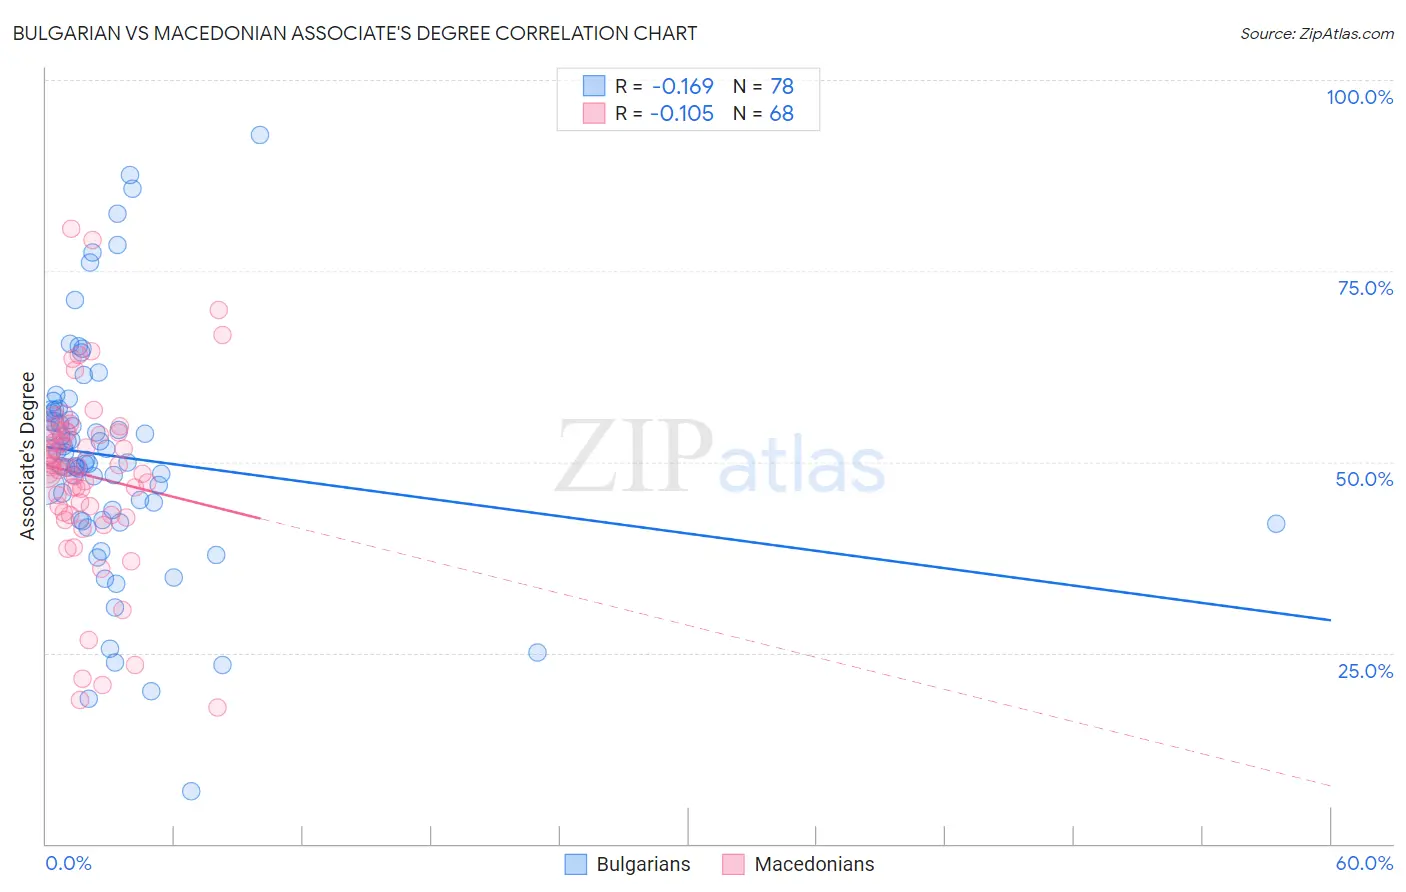
Bulgarian vs Macedonian Associate's Degree Correlation Chart
The statistical analysis conducted on geographies consisting of 205,619,803 people shows a poor negative correlation between the proportion of Bulgarians and percentage of population with at least associate's degree education in the United States with a correlation coefficient (R) of -0.169 and weighted average of 53.3%. Similarly, the statistical analysis conducted on geographies consisting of 132,656,097 people shows a poor negative correlation between the proportion of Macedonians and percentage of population with at least associate's degree education in the United States with a correlation coefficient (R) of -0.105 and weighted average of 49.6%, a difference of 7.3%.
Associate's Degree Correlation Summary
| Measurement | Bulgarian | Macedonian |
| Minimum | 6.9% | 17.8% |
| Maximum | 92.7% | 80.6% |
| Range | 85.9% | 62.7% |
| Mean | 50.7% | 48.2% |
| Median | 50.7% | 49.4% |
| Interquartile 25% (IQ1) | 42.4% | 43.2% |
| Interquartile 75% (IQ3) | 56.8% | 53.9% |
| Interquartile Range (IQR) | 14.4% | 10.6% |
| Standard Deviation (Sample) | 15.5% | 12.1% |
| Standard Deviation (Population) | 15.4% | 12.0% |
Similar Demographics by Associate's Degree
Demographics Similar to Bulgarians by Associate's Degree
In terms of associate's degree, the demographic groups most similar to Bulgarians are Russian (53.2%, a difference of 0.060%), Israeli (53.4%, a difference of 0.19%), Immigrants from Turkey (53.4%, a difference of 0.31%), Immigrants from Northern Europe (53.5%, a difference of 0.34%), and Immigrants from Russia (53.1%, a difference of 0.35%).
| Demographics | Rating | Rank | Associate's Degree |
| Latvians | 100.0 /100 | #27 | Exceptional 53.9% |
| Turks | 100.0 /100 | #28 | Exceptional 53.9% |
| Immigrants | France | 100.0 /100 | #29 | Exceptional 53.9% |
| Immigrants | Sri Lanka | 100.0 /100 | #30 | Exceptional 53.7% |
| Immigrants | Northern Europe | 100.0 /100 | #31 | Exceptional 53.5% |
| Immigrants | Turkey | 100.0 /100 | #32 | Exceptional 53.4% |
| Israelis | 100.0 /100 | #33 | Exceptional 53.4% |
| Bulgarians | 100.0 /100 | #34 | Exceptional 53.3% |
| Russians | 100.0 /100 | #35 | Exceptional 53.2% |
| Immigrants | Russia | 100.0 /100 | #36 | Exceptional 53.1% |
| Immigrants | Denmark | 100.0 /100 | #37 | Exceptional 53.1% |
| Mongolians | 100.0 /100 | #38 | Exceptional 53.0% |
| Immigrants | Belarus | 99.9 /100 | #39 | Exceptional 52.8% |
| Immigrants | Latvia | 99.9 /100 | #40 | Exceptional 52.8% |
| Immigrants | Saudi Arabia | 99.9 /100 | #41 | Exceptional 52.6% |
Demographics Similar to Macedonians by Associate's Degree
In terms of associate's degree, the demographic groups most similar to Macedonians are Immigrants from Northern Africa (49.7%, a difference of 0.070%), Romanian (49.7%, a difference of 0.16%), Immigrants from Ukraine (49.7%, a difference of 0.16%), Immigrants from England (49.7%, a difference of 0.18%), and Immigrants from Nepal (49.5%, a difference of 0.22%).
| Demographics | Rating | Rank | Associate's Degree |
| Immigrants | North America | 98.7 /100 | #92 | Exceptional 50.1% |
| Immigrants | Brazil | 98.5 /100 | #93 | Exceptional 50.0% |
| Laotians | 98.4 /100 | #94 | Exceptional 49.9% |
| Immigrants | England | 98.0 /100 | #95 | Exceptional 49.7% |
| Romanians | 98.0 /100 | #96 | Exceptional 49.7% |
| Immigrants | Ukraine | 98.0 /100 | #97 | Exceptional 49.7% |
| Immigrants | Northern Africa | 97.9 /100 | #98 | Exceptional 49.7% |
| Macedonians | 97.8 /100 | #99 | Exceptional 49.6% |
| Immigrants | Nepal | 97.5 /100 | #100 | Exceptional 49.5% |
| Northern Europeans | 97.3 /100 | #101 | Exceptional 49.5% |
| Chileans | 97.3 /100 | #102 | Exceptional 49.4% |
| Ukrainians | 97.1 /100 | #103 | Exceptional 49.4% |
| Venezuelans | 97.0 /100 | #104 | Exceptional 49.4% |
| Croatians | 96.8 /100 | #105 | Exceptional 49.3% |
| Immigrants | Italy | 96.7 /100 | #106 | Exceptional 49.3% |