Asian vs Inupiat In Labor Force | Age 20-24
COMPARE
Asian
Inupiat
In Labor Force | Age 20-24
In Labor Force | Age 20-24 Comparison
Asians
Inupiat
73.7%
IN LABOR FORCE | AGE 20-24
0.6/ 100
METRIC RATING
262nd/ 347
METRIC RANK
74.6%
IN LABOR FORCE | AGE 20-24
17.6/ 100
METRIC RATING
205th/ 347
METRIC RANK
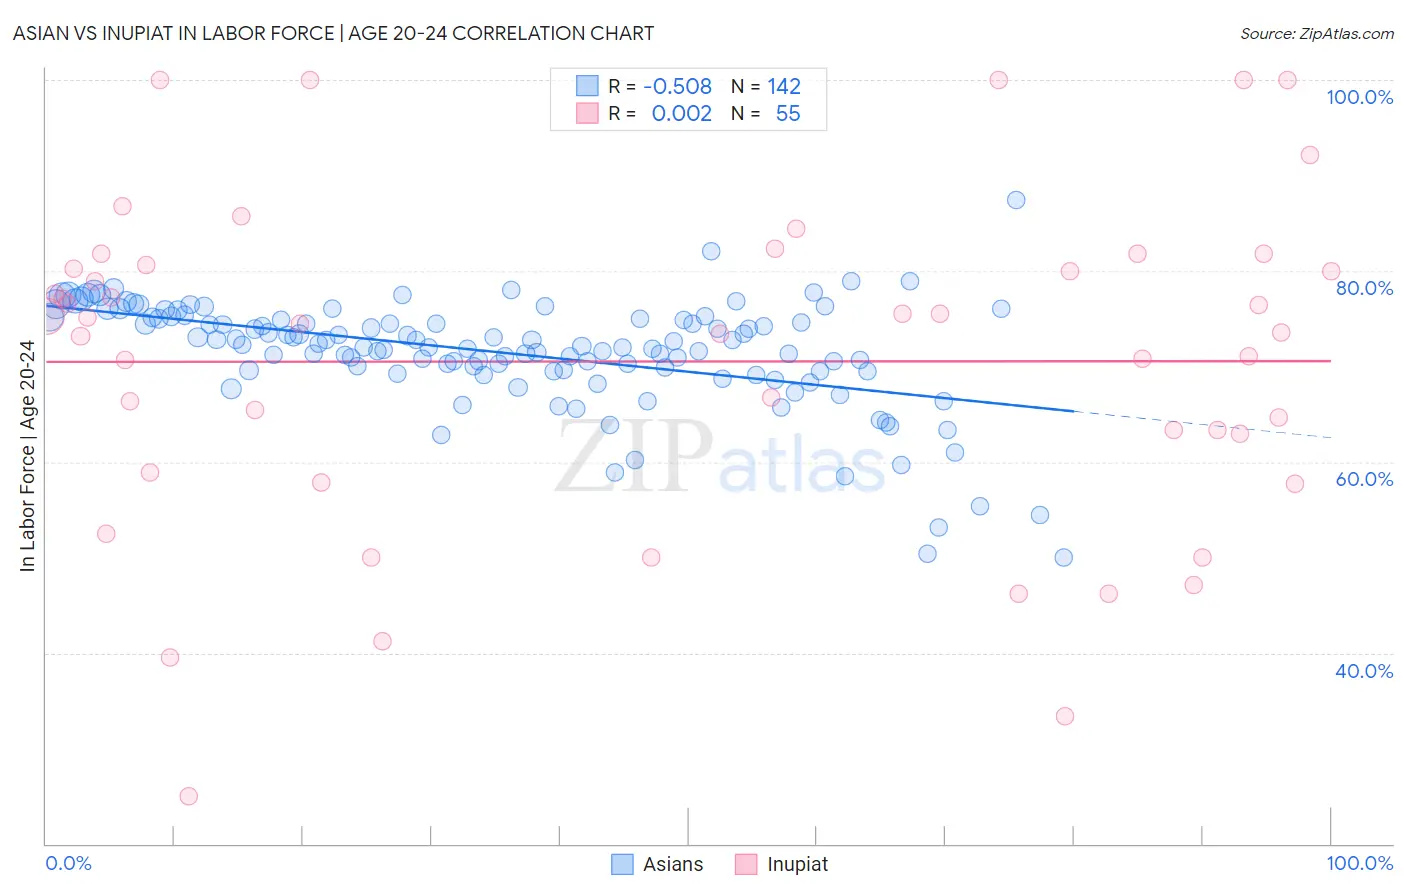
Asian vs Inupiat In Labor Force | Age 20-24 Correlation Chart
The statistical analysis conducted on geographies consisting of 550,133,800 people shows a substantial negative correlation between the proportion of Asians and labor force participation rate among population between the ages 20 and 24 in the United States with a correlation coefficient (R) of -0.508 and weighted average of 73.7%. Similarly, the statistical analysis conducted on geographies consisting of 96,340,626 people shows no correlation between the proportion of Inupiat and labor force participation rate among population between the ages 20 and 24 in the United States with a correlation coefficient (R) of 0.002 and weighted average of 74.6%, a difference of 1.3%.
In Labor Force | Age 20-24 Correlation Summary
| Measurement | Asian | Inupiat |
| Minimum | 50.0% | 25.0% |
| Maximum | 87.4% | 100.0% |
| Range | 37.4% | 75.0% |
| Mean | 71.4% | 70.5% |
| Median | 72.2% | 74.5% |
| Interquartile 25% (IQ1) | 69.5% | 58.9% |
| Interquartile 75% (IQ3) | 75.0% | 80.6% |
| Interquartile Range (IQR) | 5.5% | 21.7% |
| Standard Deviation (Sample) | 5.8% | 17.3% |
| Standard Deviation (Population) | 5.8% | 17.1% |
Similar Demographics by In Labor Force | Age 20-24
Demographics Similar to Asians by In Labor Force | Age 20-24
In terms of in labor force | age 20-24, the demographic groups most similar to Asians are Houma (73.7%, a difference of 0.010%), Immigrants from Turkey (73.7%, a difference of 0.020%), Egyptian (73.7%, a difference of 0.050%), Dutch West Indian (73.7%, a difference of 0.050%), and Immigrants from Asia (73.6%, a difference of 0.080%).
| Demographics | Rating | Rank | In Labor Force | Age 20-24 |
| Immigrants | Pakistan | 0.9 /100 | #255 | Tragic 73.8% |
| Spanish American Indians | 0.8 /100 | #256 | Tragic 73.7% |
| Paraguayans | 0.8 /100 | #257 | Tragic 73.7% |
| Egyptians | 0.7 /100 | #258 | Tragic 73.7% |
| Dutch West Indians | 0.7 /100 | #259 | Tragic 73.7% |
| Immigrants | Turkey | 0.7 /100 | #260 | Tragic 73.7% |
| Houma | 0.6 /100 | #261 | Tragic 73.7% |
| Asians | 0.6 /100 | #262 | Tragic 73.7% |
| Immigrants | Asia | 0.5 /100 | #263 | Tragic 73.6% |
| Immigrants | Haiti | 0.5 /100 | #264 | Tragic 73.6% |
| Burmese | 0.5 /100 | #265 | Tragic 73.6% |
| Haitians | 0.5 /100 | #266 | Tragic 73.6% |
| Immigrants | Western Asia | 0.4 /100 | #267 | Tragic 73.5% |
| South Americans | 0.4 /100 | #268 | Tragic 73.5% |
| Colombians | 0.3 /100 | #269 | Tragic 73.5% |
Demographics Similar to Inupiat by In Labor Force | Age 20-24
In terms of in labor force | age 20-24, the demographic groups most similar to Inupiat are Immigrants from Italy (74.6%, a difference of 0.0%), Sioux (74.6%, a difference of 0.0%), Immigrants from Northern Africa (74.6%, a difference of 0.010%), Albanian (74.6%, a difference of 0.040%), and Immigrants from Uruguay (74.6%, a difference of 0.050%).
| Demographics | Rating | Rank | In Labor Force | Age 20-24 |
| Immigrants | Nigeria | 24.2 /100 | #198 | Fair 74.7% |
| Taiwanese | 23.2 /100 | #199 | Fair 74.7% |
| Nigerians | 21.9 /100 | #200 | Fair 74.7% |
| Choctaw | 21.4 /100 | #201 | Fair 74.7% |
| Moroccans | 20.4 /100 | #202 | Fair 74.7% |
| Immigrants | Northern Africa | 17.9 /100 | #203 | Poor 74.6% |
| Immigrants | Italy | 17.6 /100 | #204 | Poor 74.6% |
| Inupiat | 17.6 /100 | #205 | Poor 74.6% |
| Sioux | 17.5 /100 | #206 | Poor 74.6% |
| Albanians | 16.2 /100 | #207 | Poor 74.6% |
| Immigrants | Uruguay | 15.8 /100 | #208 | Poor 74.6% |
| Arabs | 15.8 /100 | #209 | Poor 74.6% |
| Uruguayans | 15.1 /100 | #210 | Poor 74.6% |
| Immigrants | Australia | 14.7 /100 | #211 | Poor 74.6% |
| Creek | 13.3 /100 | #212 | Poor 74.5% |