Argentinean vs Immigrants from Senegal Unemployment Among Ages 20 to 24 years
COMPARE
Argentinean
Immigrants from Senegal
Unemployment Among Ages 20 to 24 years
Unemployment Among Ages 20 to 24 years Comparison
Argentineans
Immigrants from Senegal
10.2%
UNEMPLOYMENT AMONG AGES 20 TO 24 YEARS
78.0/ 100
METRIC RATING
145th/ 347
METRIC RANK
11.9%
UNEMPLOYMENT AMONG AGES 20 TO 24 YEARS
0.0/ 100
METRIC RATING
292nd/ 347
METRIC RANK
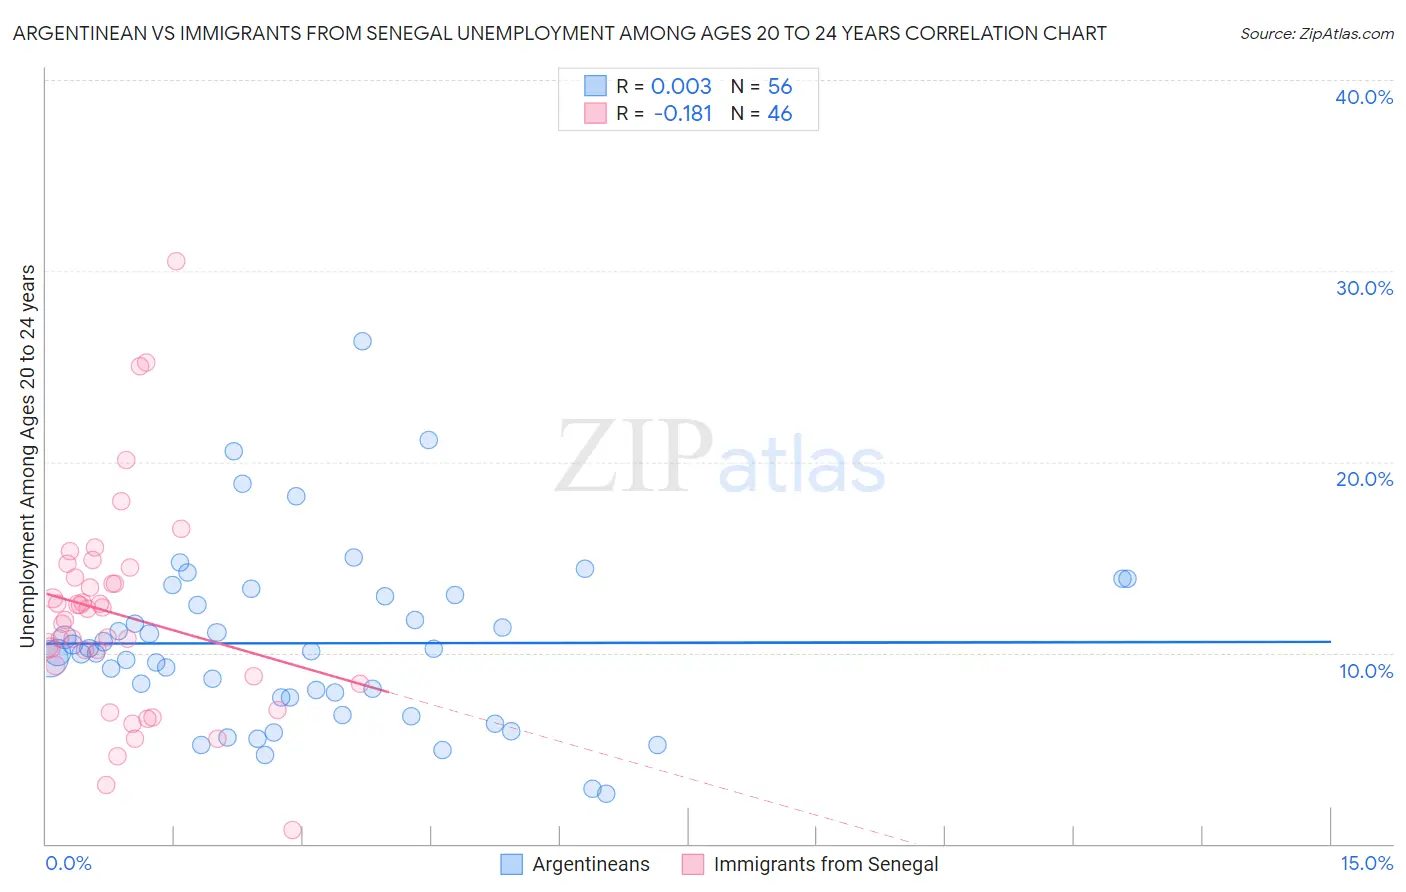
Argentinean vs Immigrants from Senegal Unemployment Among Ages 20 to 24 years Correlation Chart
The statistical analysis conducted on geographies consisting of 292,519,448 people shows no correlation between the proportion of Argentineans and unemployment rate among population between the ages 20 and 24 in the United States with a correlation coefficient (R) of 0.003 and weighted average of 10.2%. Similarly, the statistical analysis conducted on geographies consisting of 89,868,284 people shows a poor negative correlation between the proportion of Immigrants from Senegal and unemployment rate among population between the ages 20 and 24 in the United States with a correlation coefficient (R) of -0.181 and weighted average of 11.9%, a difference of 17.0%.
Unemployment Among Ages 20 to 24 years Correlation Summary
| Measurement | Argentinean | Immigrants from Senegal |
| Minimum | 2.6% | 0.70% |
| Maximum | 26.3% | 30.5% |
| Range | 23.7% | 29.8% |
| Mean | 10.5% | 12.0% |
| Median | 10.1% | 12.0% |
| Interquartile 25% (IQ1) | 7.6% | 8.8% |
| Interquartile 75% (IQ3) | 13.0% | 13.9% |
| Interquartile Range (IQR) | 5.4% | 5.1% |
| Standard Deviation (Sample) | 4.6% | 5.6% |
| Standard Deviation (Population) | 4.5% | 5.5% |
Similar Demographics by Unemployment Among Ages 20 to 24 years
Demographics Similar to Argentineans by Unemployment Among Ages 20 to 24 years
In terms of unemployment among ages 20 to 24 years, the demographic groups most similar to Argentineans are Brazilian (10.2%, a difference of 0.020%), Asian (10.2%, a difference of 0.020%), French Canadian (10.2%, a difference of 0.030%), Immigrants from Jordan (10.2%, a difference of 0.060%), and Immigrants from Romania (10.2%, a difference of 0.12%).
| Demographics | Rating | Rank | Unemployment Among Ages 20 to 24 years |
| Burmese | 82.3 /100 | #138 | Excellent 10.2% |
| Uruguayans | 81.9 /100 | #139 | Excellent 10.2% |
| Immigrants | Austria | 81.4 /100 | #140 | Excellent 10.2% |
| Immigrants | Azores | 81.4 /100 | #141 | Excellent 10.2% |
| Slovaks | 80.2 /100 | #142 | Excellent 10.2% |
| Immigrants | Jordan | 79.0 /100 | #143 | Good 10.2% |
| Brazilians | 78.4 /100 | #144 | Good 10.2% |
| Argentineans | 78.0 /100 | #145 | Good 10.2% |
| Asians | 77.7 /100 | #146 | Good 10.2% |
| French Canadians | 77.5 /100 | #147 | Good 10.2% |
| Immigrants | Romania | 75.7 /100 | #148 | Good 10.2% |
| Immigrants | Scotland | 74.6 /100 | #149 | Good 10.2% |
| Hungarians | 74.4 /100 | #150 | Good 10.2% |
| Immigrants | South Africa | 73.6 /100 | #151 | Good 10.2% |
| Iranians | 72.4 /100 | #152 | Good 10.2% |
Demographics Similar to Immigrants from Senegal by Unemployment Among Ages 20 to 24 years
In terms of unemployment among ages 20 to 24 years, the demographic groups most similar to Immigrants from Senegal are Central American Indian (11.9%, a difference of 0.080%), Immigrants from Ghana (11.9%, a difference of 0.23%), Immigrants from Belize (12.0%, a difference of 0.26%), Immigrants from Armenia (12.0%, a difference of 0.44%), and Cajun (12.0%, a difference of 0.47%).
| Demographics | Rating | Rank | Unemployment Among Ages 20 to 24 years |
| Soviet Union | 0.0 /100 | #285 | Tragic 11.7% |
| Ecuadorians | 0.0 /100 | #286 | Tragic 11.8% |
| Immigrants | Ecuador | 0.0 /100 | #287 | Tragic 11.8% |
| U.S. Virgin Islanders | 0.0 /100 | #288 | Tragic 11.8% |
| Belizeans | 0.0 /100 | #289 | Tragic 11.8% |
| Immigrants | Caribbean | 0.0 /100 | #290 | Tragic 11.8% |
| Central American Indians | 0.0 /100 | #291 | Tragic 11.9% |
| Immigrants | Senegal | 0.0 /100 | #292 | Tragic 11.9% |
| Immigrants | Ghana | 0.0 /100 | #293 | Tragic 11.9% |
| Immigrants | Belize | 0.0 /100 | #294 | Tragic 12.0% |
| Immigrants | Armenia | 0.0 /100 | #295 | Tragic 12.0% |
| Cajuns | 0.0 /100 | #296 | Tragic 12.0% |
| Blackfeet | 0.0 /100 | #297 | Tragic 12.0% |
| Lumbee | 0.0 /100 | #298 | Tragic 12.0% |
| Apache | 0.0 /100 | #299 | Tragic 12.0% |