Argentinean vs Immigrants from Senegal Ambulatory Disability
COMPARE
Argentinean
Immigrants from Senegal
Ambulatory Disability
Ambulatory Disability Comparison
Argentineans
Immigrants from Senegal
5.5%
AMBULATORY DISABILITY
99.9/ 100
METRIC RATING
42nd/ 347
METRIC RANK
6.4%
AMBULATORY DISABILITY
1.7/ 100
METRIC RATING
240th/ 347
METRIC RANK
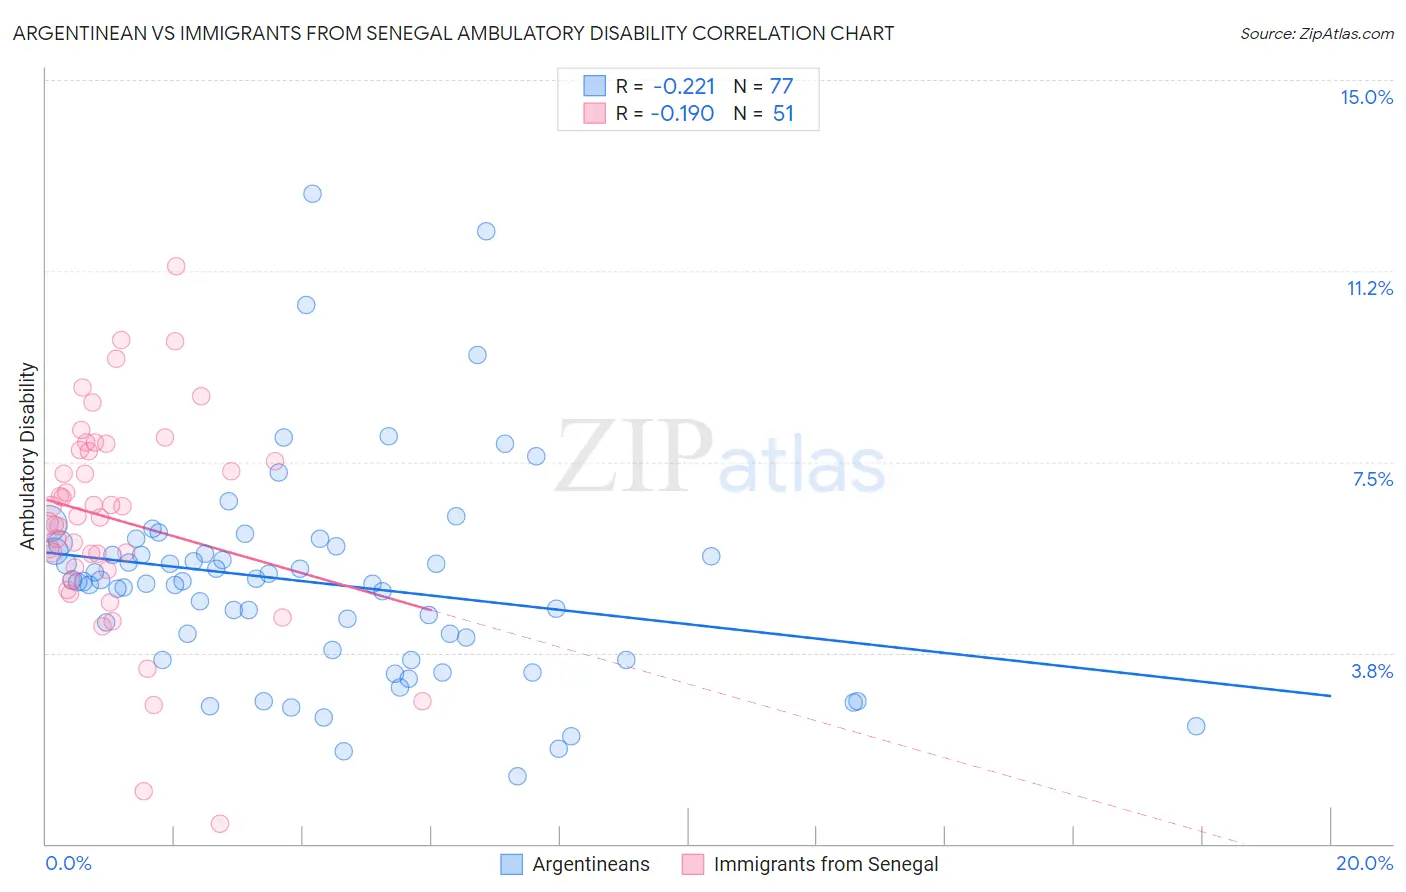
Argentinean vs Immigrants from Senegal Ambulatory Disability Correlation Chart
The statistical analysis conducted on geographies consisting of 297,088,064 people shows a weak negative correlation between the proportion of Argentineans and percentage of population with ambulatory disability in the United States with a correlation coefficient (R) of -0.221 and weighted average of 5.5%. Similarly, the statistical analysis conducted on geographies consisting of 90,127,972 people shows a poor negative correlation between the proportion of Immigrants from Senegal and percentage of population with ambulatory disability in the United States with a correlation coefficient (R) of -0.190 and weighted average of 6.4%, a difference of 17.0%.
Ambulatory Disability Correlation Summary
| Measurement | Argentinean | Immigrants from Senegal |
| Minimum | 1.3% | 0.40% |
| Maximum | 12.8% | 11.3% |
| Range | 11.5% | 10.9% |
| Mean | 5.1% | 6.4% |
| Median | 5.1% | 6.4% |
| Interquartile 25% (IQ1) | 3.7% | 5.4% |
| Interquartile 75% (IQ3) | 5.8% | 7.7% |
| Interquartile Range (IQR) | 2.1% | 2.4% |
| Standard Deviation (Sample) | 2.1% | 2.1% |
| Standard Deviation (Population) | 2.1% | 2.1% |
Similar Demographics by Ambulatory Disability
Demographics Similar to Argentineans by Ambulatory Disability
In terms of ambulatory disability, the demographic groups most similar to Argentineans are Mongolian (5.5%, a difference of 0.080%), Venezuelan (5.5%, a difference of 0.16%), Immigrants from Eritrea (5.5%, a difference of 0.50%), Paraguayan (5.5%, a difference of 0.54%), and Turkish (5.5%, a difference of 0.59%).
| Demographics | Rating | Rank | Ambulatory Disability |
| Afghans | 100.0 /100 | #35 | Exceptional 5.5% |
| Immigrants | Malaysia | 100.0 /100 | #36 | Exceptional 5.5% |
| Turks | 100.0 /100 | #37 | Exceptional 5.5% |
| Cypriots | 100.0 /100 | #38 | Exceptional 5.5% |
| Immigrants | Eritrea | 100.0 /100 | #39 | Exceptional 5.5% |
| Venezuelans | 99.9 /100 | #40 | Exceptional 5.5% |
| Mongolians | 99.9 /100 | #41 | Exceptional 5.5% |
| Argentineans | 99.9 /100 | #42 | Exceptional 5.5% |
| Paraguayans | 99.9 /100 | #43 | Exceptional 5.5% |
| Immigrants | Indonesia | 99.9 /100 | #44 | Exceptional 5.5% |
| Immigrants | Sweden | 99.9 /100 | #45 | Exceptional 5.6% |
| Egyptians | 99.9 /100 | #46 | Exceptional 5.6% |
| Immigrants | Japan | 99.9 /100 | #47 | Exceptional 5.6% |
| Immigrants | Argentina | 99.9 /100 | #48 | Exceptional 5.6% |
| Bulgarians | 99.9 /100 | #49 | Exceptional 5.6% |
Demographics Similar to Immigrants from Senegal by Ambulatory Disability
In terms of ambulatory disability, the demographic groups most similar to Immigrants from Senegal are Senegalese (6.4%, a difference of 0.030%), Immigrants from Haiti (6.5%, a difference of 0.080%), Haitian (6.4%, a difference of 0.090%), Immigrants from Germany (6.4%, a difference of 0.10%), and Spaniard (6.5%, a difference of 0.11%).
| Demographics | Rating | Rank | Ambulatory Disability |
| Sub-Saharan Africans | 2.3 /100 | #233 | Tragic 6.4% |
| Immigrants | Liberia | 2.3 /100 | #234 | Tragic 6.4% |
| Hispanics or Latinos | 2.2 /100 | #235 | Tragic 6.4% |
| Dutch | 2.0 /100 | #236 | Tragic 6.4% |
| Immigrants | Germany | 1.8 /100 | #237 | Tragic 6.4% |
| Haitians | 1.8 /100 | #238 | Tragic 6.4% |
| Senegalese | 1.7 /100 | #239 | Tragic 6.4% |
| Immigrants | Senegal | 1.7 /100 | #240 | Tragic 6.4% |
| Immigrants | Haiti | 1.6 /100 | #241 | Tragic 6.5% |
| Spaniards | 1.6 /100 | #242 | Tragic 6.5% |
| Germans | 1.5 /100 | #243 | Tragic 6.5% |
| Immigrants | Panama | 1.5 /100 | #244 | Tragic 6.5% |
| Tlingit-Haida | 1.5 /100 | #245 | Tragic 6.5% |
| Armenians | 1.5 /100 | #246 | Tragic 6.5% |
| Immigrants | Cuba | 1.4 /100 | #247 | Tragic 6.5% |