Argentinean vs Immigrants from Senegal Householder Income Ages 45 - 64 years
COMPARE
Argentinean
Immigrants from Senegal
Householder Income Ages 45 - 64 years
Householder Income Ages 45 - 64 years Comparison
Argentineans
Immigrants from Senegal
$110,103
HOUSEHOLDER INCOME AGES 45 - 64 YEARS
99.3/ 100
METRIC RATING
73rd/ 347
METRIC RANK
$88,421
HOUSEHOLDER INCOME AGES 45 - 64 YEARS
0.3/ 100
METRIC RATING
263rd/ 347
METRIC RANK
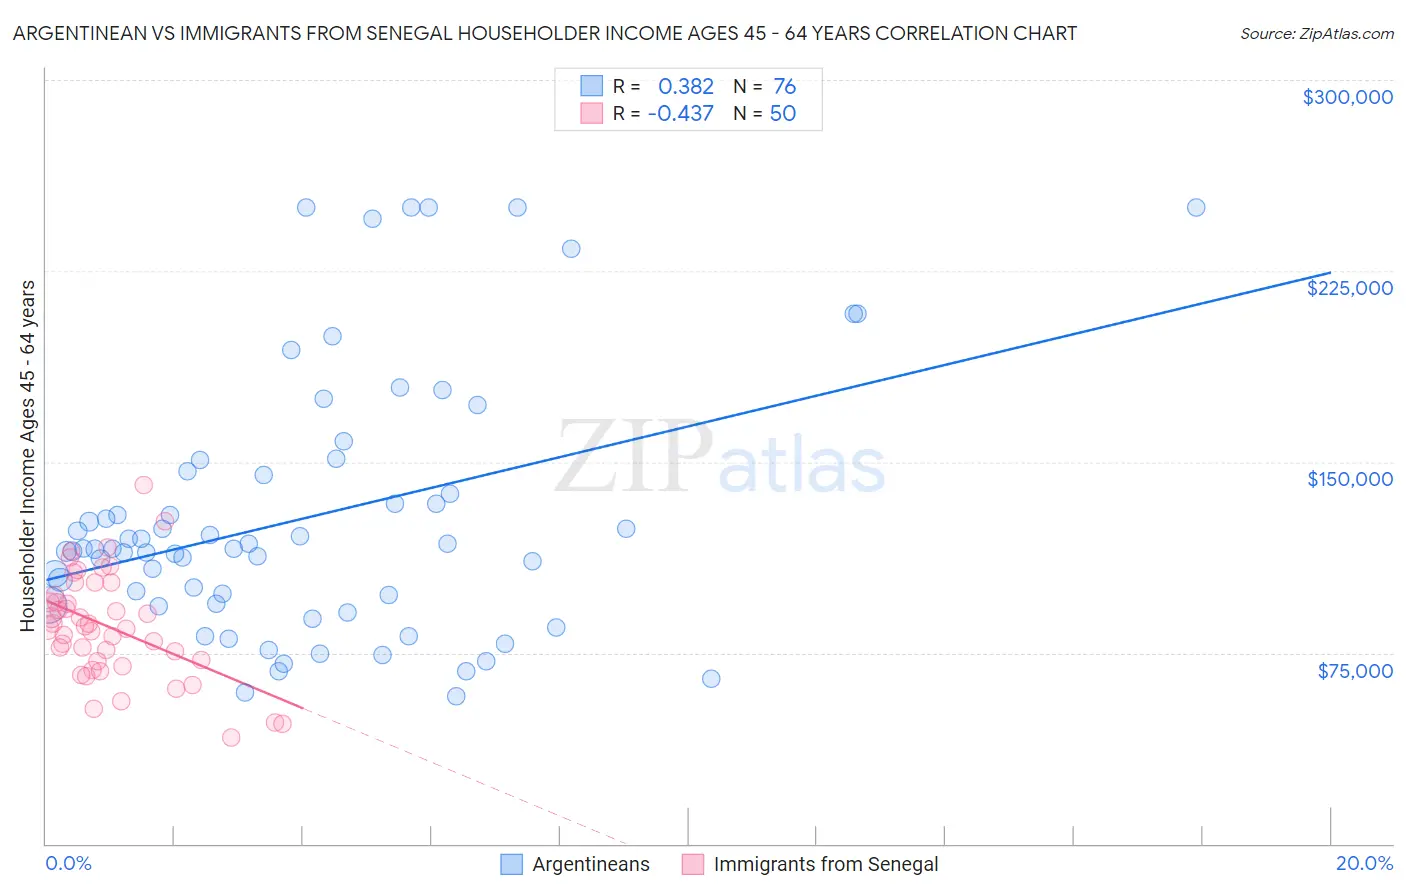
Argentinean vs Immigrants from Senegal Householder Income Ages 45 - 64 years Correlation Chart
The statistical analysis conducted on geographies consisting of 296,812,150 people shows a mild positive correlation between the proportion of Argentineans and household income with householder between the ages 45 and 64 in the United States with a correlation coefficient (R) of 0.382 and weighted average of $110,103. Similarly, the statistical analysis conducted on geographies consisting of 90,099,692 people shows a moderate negative correlation between the proportion of Immigrants from Senegal and household income with householder between the ages 45 and 64 in the United States with a correlation coefficient (R) of -0.437 and weighted average of $88,421, a difference of 24.5%.
Householder Income Ages 45 - 64 years Correlation Summary
| Measurement | Argentinean | Immigrants from Senegal |
| Minimum | $57,969 | $41,574 |
| Maximum | $250,001 | $140,938 |
| Range | $192,032 | $99,364 |
| Mean | $128,288 | $85,290 |
| Median | $115,931 | $85,076 |
| Interquartile 25% (IQ1) | $94,003 | $71,475 |
| Interquartile 75% (IQ3) | $145,452 | $97,575 |
| Interquartile Range (IQR) | $51,448 | $26,100 |
| Standard Deviation (Sample) | $50,936 | $20,782 |
| Standard Deviation (Population) | $50,600 | $20,574 |
Similar Demographics by Householder Income Ages 45 - 64 years
Demographics Similar to Argentineans by Householder Income Ages 45 - 64 years
In terms of householder income ages 45 - 64 years, the demographic groups most similar to Argentineans are Assyrian/Chaldean/Syriac ($110,201, a difference of 0.090%), Italian ($110,224, a difference of 0.11%), Immigrants from Egypt ($109,941, a difference of 0.15%), Korean ($110,334, a difference of 0.21%), and Immigrants from Italy ($110,434, a difference of 0.30%).
| Demographics | Rating | Rank | Householder Income Ages 45 - 64 years |
| New Zealanders | 99.6 /100 | #66 | Exceptional $111,286 |
| Laotians | 99.5 /100 | #67 | Exceptional $111,051 |
| Immigrants | Romania | 99.4 /100 | #68 | Exceptional $110,633 |
| Immigrants | Italy | 99.4 /100 | #69 | Exceptional $110,434 |
| Koreans | 99.3 /100 | #70 | Exceptional $110,334 |
| Italians | 99.3 /100 | #71 | Exceptional $110,224 |
| Assyrians/Chaldeans/Syriacs | 99.3 /100 | #72 | Exceptional $110,201 |
| Argentineans | 99.3 /100 | #73 | Exceptional $110,103 |
| Immigrants | Egypt | 99.2 /100 | #74 | Exceptional $109,941 |
| South Africans | 99.1 /100 | #75 | Exceptional $109,719 |
| Paraguayans | 99.0 /100 | #76 | Exceptional $109,447 |
| Immigrants | England | 99.0 /100 | #77 | Exceptional $109,446 |
| Immigrants | Canada | 99.0 /100 | #78 | Exceptional $109,402 |
| Immigrants | Bulgaria | 98.9 /100 | #79 | Exceptional $109,379 |
| Jordanians | 98.9 /100 | #80 | Exceptional $109,376 |
Demographics Similar to Immigrants from Senegal by Householder Income Ages 45 - 64 years
In terms of householder income ages 45 - 64 years, the demographic groups most similar to Immigrants from Senegal are Osage ($88,390, a difference of 0.040%), Jamaican ($88,327, a difference of 0.11%), Somali ($88,600, a difference of 0.20%), Immigrants from West Indies ($88,164, a difference of 0.29%), and Belizean ($88,684, a difference of 0.30%).
| Demographics | Rating | Rank | Householder Income Ages 45 - 64 years |
| French American Indians | 0.5 /100 | #256 | Tragic $89,811 |
| German Russians | 0.4 /100 | #257 | Tragic $89,398 |
| Immigrants | Barbados | 0.4 /100 | #258 | Tragic $89,394 |
| Immigrants | Nicaragua | 0.4 /100 | #259 | Tragic $89,108 |
| Liberians | 0.3 /100 | #260 | Tragic $88,929 |
| Belizeans | 0.3 /100 | #261 | Tragic $88,684 |
| Somalis | 0.3 /100 | #262 | Tragic $88,600 |
| Immigrants | Senegal | 0.3 /100 | #263 | Tragic $88,421 |
| Osage | 0.3 /100 | #264 | Tragic $88,390 |
| Jamaicans | 0.2 /100 | #265 | Tragic $88,327 |
| Immigrants | West Indies | 0.2 /100 | #266 | Tragic $88,164 |
| Hmong | 0.2 /100 | #267 | Tragic $88,115 |
| Immigrants | Micronesia | 0.2 /100 | #268 | Tragic $87,864 |
| Spanish Americans | 0.2 /100 | #269 | Tragic $87,836 |
| Immigrants | Liberia | 0.2 /100 | #270 | Tragic $87,739 |