Argentinean vs Immigrants from Senegal Child Poverty Under the Age of 16
COMPARE
Argentinean
Immigrants from Senegal
Child Poverty Under the Age of 16
Child Poverty Under the Age of 16 Comparison
Argentineans
Immigrants from Senegal
14.6%
CHILD POVERTY UNDER THE AGE OF 16
96.6/ 100
METRIC RATING
93rd/ 347
METRIC RANK
20.6%
CHILD POVERTY UNDER THE AGE OF 16
0.0/ 100
METRIC RATING
293rd/ 347
METRIC RANK
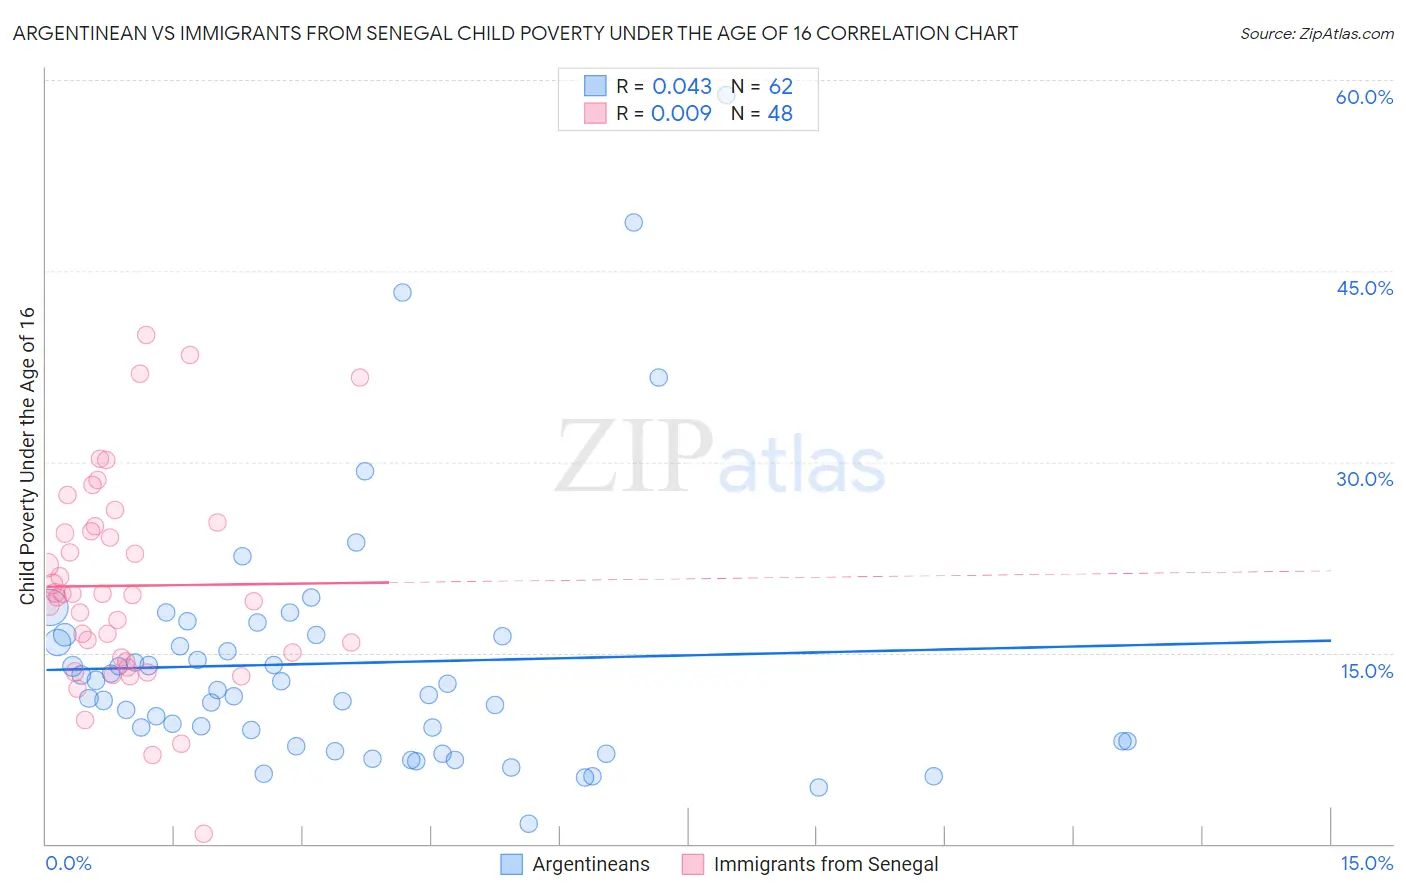
Argentinean vs Immigrants from Senegal Child Poverty Under the Age of 16 Correlation Chart
The statistical analysis conducted on geographies consisting of 295,166,433 people shows no correlation between the proportion of Argentineans and poverty level among children under the age of 16 in the United States with a correlation coefficient (R) of 0.043 and weighted average of 14.6%. Similarly, the statistical analysis conducted on geographies consisting of 90,000,825 people shows no correlation between the proportion of Immigrants from Senegal and poverty level among children under the age of 16 in the United States with a correlation coefficient (R) of 0.009 and weighted average of 20.6%, a difference of 41.4%.
Child Poverty Under the Age of 16 Correlation Summary
| Measurement | Argentinean | Immigrants from Senegal |
| Minimum | 1.6% | 0.74% |
| Maximum | 58.8% | 40.0% |
| Range | 57.2% | 39.3% |
| Mean | 14.2% | 20.3% |
| Median | 11.9% | 19.6% |
| Interquartile 25% (IQ1) | 8.0% | 14.5% |
| Interquartile 75% (IQ3) | 16.3% | 24.8% |
| Interquartile Range (IQR) | 8.2% | 10.3% |
| Standard Deviation (Sample) | 10.3% | 8.2% |
| Standard Deviation (Population) | 10.2% | 8.1% |
Similar Demographics by Child Poverty Under the Age of 16
Demographics Similar to Argentineans by Child Poverty Under the Age of 16
In terms of child poverty under the age of 16, the demographic groups most similar to Argentineans are Immigrants from Italy (14.6%, a difference of 0.090%), Immigrants from North America (14.6%, a difference of 0.12%), Immigrants from South Africa (14.6%, a difference of 0.28%), Austrian (14.5%, a difference of 0.31%), and German (14.5%, a difference of 0.37%).
| Demographics | Rating | Rank | Child Poverty Under the Age of 16 |
| Immigrants | Argentina | 97.1 /100 | #86 | Exceptional 14.5% |
| Taiwanese | 97.1 /100 | #87 | Exceptional 14.5% |
| Northern Europeans | 97.0 /100 | #88 | Exceptional 14.5% |
| Germans | 96.9 /100 | #89 | Exceptional 14.5% |
| Austrians | 96.9 /100 | #90 | Exceptional 14.5% |
| Immigrants | North America | 96.7 /100 | #91 | Exceptional 14.6% |
| Immigrants | Italy | 96.7 /100 | #92 | Exceptional 14.6% |
| Argentineans | 96.6 /100 | #93 | Exceptional 14.6% |
| Immigrants | South Africa | 96.3 /100 | #94 | Exceptional 14.6% |
| Immigrants | Croatia | 96.1 /100 | #95 | Exceptional 14.6% |
| Immigrants | France | 95.8 /100 | #96 | Exceptional 14.7% |
| Paraguayans | 95.7 /100 | #97 | Exceptional 14.7% |
| Immigrants | Belarus | 95.7 /100 | #98 | Exceptional 14.7% |
| British | 95.5 /100 | #99 | Exceptional 14.7% |
| Dutch | 95.1 /100 | #100 | Exceptional 14.8% |
Demographics Similar to Immigrants from Senegal by Child Poverty Under the Age of 16
In terms of child poverty under the age of 16, the demographic groups most similar to Immigrants from Senegal are Haitian (20.7%, a difference of 0.21%), Mexican (20.7%, a difference of 0.34%), Immigrants from Latin America (20.5%, a difference of 0.43%), Chippewa (20.5%, a difference of 0.47%), and Immigrants from Caribbean (20.8%, a difference of 0.73%).
| Demographics | Rating | Rank | Child Poverty Under the Age of 16 |
| Immigrants | West Indies | 0.0 /100 | #286 | Tragic 20.2% |
| Blackfeet | 0.0 /100 | #287 | Tragic 20.2% |
| Immigrants | Belize | 0.0 /100 | #288 | Tragic 20.3% |
| Senegalese | 0.0 /100 | #289 | Tragic 20.4% |
| Yaqui | 0.0 /100 | #290 | Tragic 20.4% |
| Chippewa | 0.0 /100 | #291 | Tragic 20.5% |
| Immigrants | Latin America | 0.0 /100 | #292 | Tragic 20.5% |
| Immigrants | Senegal | 0.0 /100 | #293 | Tragic 20.6% |
| Haitians | 0.0 /100 | #294 | Tragic 20.7% |
| Mexicans | 0.0 /100 | #295 | Tragic 20.7% |
| Immigrants | Caribbean | 0.0 /100 | #296 | Tragic 20.8% |
| Hispanics or Latinos | 0.0 /100 | #297 | Tragic 20.8% |
| Arapaho | 0.0 /100 | #298 | Tragic 20.8% |
| Immigrants | Haiti | 0.0 /100 | #299 | Tragic 20.9% |
| Indonesians | 0.0 /100 | #300 | Tragic 21.0% |