Argentinean vs Immigrants from Eastern Africa 10th Grade
COMPARE
Argentinean
Immigrants from Eastern Africa
10th Grade
10th Grade Comparison
Argentineans
Immigrants from Eastern Africa
93.7%
10TH GRADE
50.0/ 100
METRIC RATING
174th/ 347
METRIC RANK
93.4%
10TH GRADE
14.7/ 100
METRIC RATING
216th/ 347
METRIC RANK
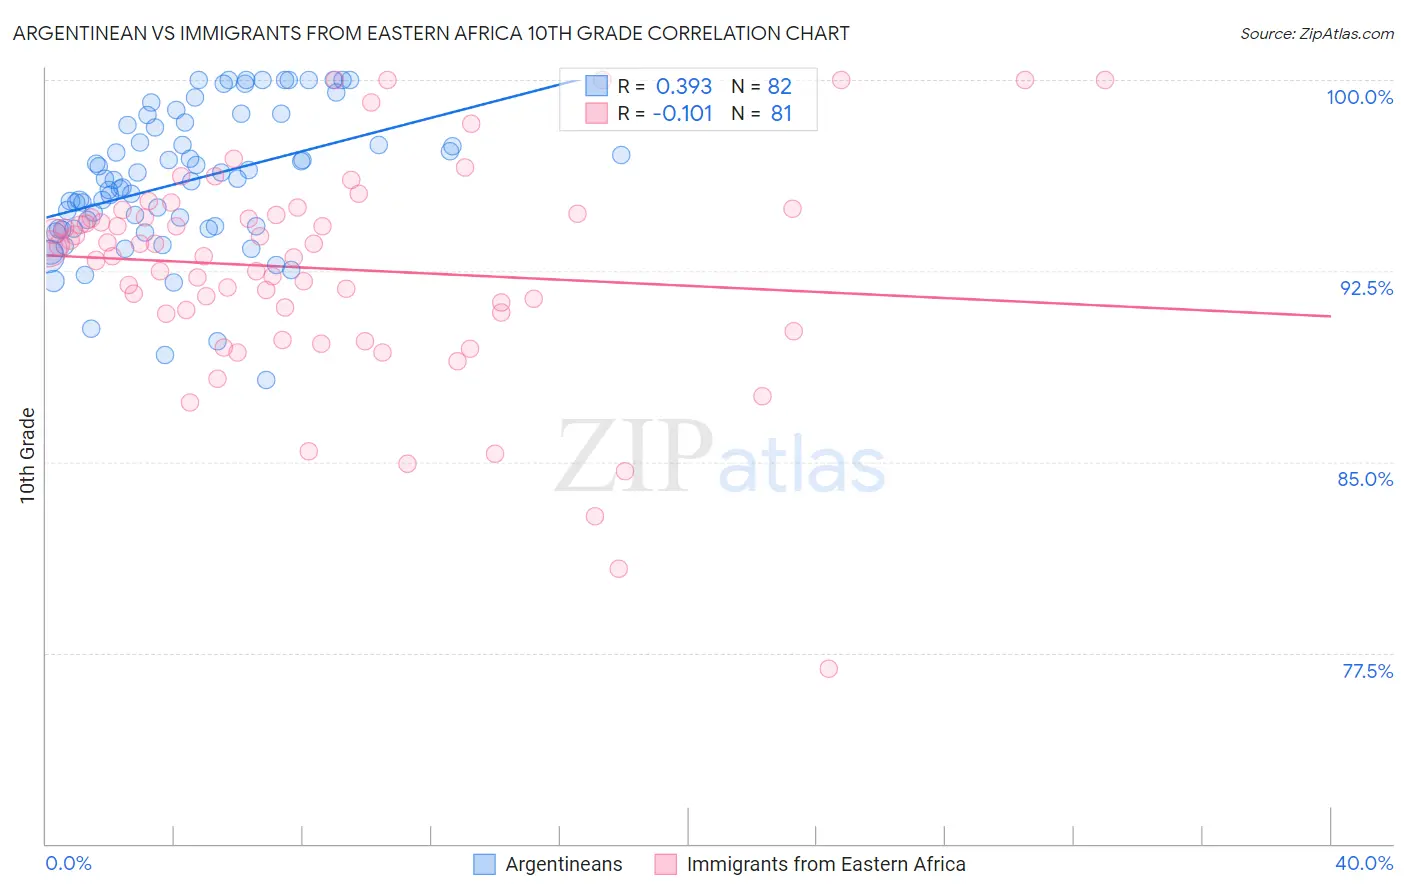
Argentinean vs Immigrants from Eastern Africa 10th Grade Correlation Chart
The statistical analysis conducted on geographies consisting of 297,145,104 people shows a mild positive correlation between the proportion of Argentineans and percentage of population with at least 10th grade education in the United States with a correlation coefficient (R) of 0.393 and weighted average of 93.7%. Similarly, the statistical analysis conducted on geographies consisting of 355,144,184 people shows a poor negative correlation between the proportion of Immigrants from Eastern Africa and percentage of population with at least 10th grade education in the United States with a correlation coefficient (R) of -0.101 and weighted average of 93.4%, a difference of 0.40%.
10th Grade Correlation Summary
| Measurement | Argentinean | Immigrants from Eastern Africa |
| Minimum | 88.2% | 76.9% |
| Maximum | 100.0% | 100.0% |
| Range | 11.8% | 23.1% |
| Mean | 96.0% | 92.6% |
| Median | 96.1% | 93.4% |
| Interquartile 25% (IQ1) | 94.2% | 90.8% |
| Interquartile 75% (IQ3) | 98.3% | 94.7% |
| Interquartile Range (IQR) | 4.1% | 3.9% |
| Standard Deviation (Sample) | 2.8% | 4.3% |
| Standard Deviation (Population) | 2.7% | 4.2% |
Similar Demographics by 10th Grade
Demographics Similar to Argentineans by 10th Grade
In terms of 10th grade, the demographic groups most similar to Argentineans are Spaniard (93.7%, a difference of 0.0%), Immigrants from Nepal (93.7%, a difference of 0.0%), French American Indian (93.7%, a difference of 0.010%), Immigrants from Albania (93.8%, a difference of 0.020%), and Immigrants from Venezuela (93.8%, a difference of 0.030%).
| Demographics | Rating | Rank | 10th Grade |
| Immigrants | Egypt | 62.3 /100 | #167 | Good 93.8% |
| Alsatians | 59.4 /100 | #168 | Average 93.8% |
| Immigrants | Spain | 55.9 /100 | #169 | Average 93.8% |
| Immigrants | Venezuela | 53.9 /100 | #170 | Average 93.8% |
| Immigrants | Albania | 52.4 /100 | #171 | Average 93.8% |
| French American Indians | 50.9 /100 | #172 | Average 93.7% |
| Spaniards | 50.3 /100 | #173 | Average 93.7% |
| Argentineans | 50.0 /100 | #174 | Average 93.7% |
| Immigrants | Nepal | 49.6 /100 | #175 | Average 93.7% |
| Immigrants | Argentina | 47.1 /100 | #176 | Average 93.7% |
| Immigrants | Lebanon | 47.1 /100 | #177 | Average 93.7% |
| Sierra Leoneans | 46.1 /100 | #178 | Average 93.7% |
| Paraguayans | 45.3 /100 | #179 | Average 93.7% |
| Blackfeet | 42.8 /100 | #180 | Average 93.7% |
| Immigrants | Northern Africa | 41.6 /100 | #181 | Average 93.7% |
Demographics Similar to Immigrants from Eastern Africa by 10th Grade
In terms of 10th grade, the demographic groups most similar to Immigrants from Eastern Africa are Immigrants from Bahamas (93.4%, a difference of 0.010%), Immigrants from Oceania (93.4%, a difference of 0.010%), Immigrants from Asia (93.4%, a difference of 0.020%), Immigrants from Zaire (93.4%, a difference of 0.030%), and Cajun (93.4%, a difference of 0.040%).
| Demographics | Rating | Rank | 10th Grade |
| Immigrants | Chile | 18.8 /100 | #209 | Poor 93.4% |
| Indians (Asian) | 17.6 /100 | #210 | Poor 93.4% |
| Cajuns | 16.9 /100 | #211 | Poor 93.4% |
| Immigrants | Zaire | 16.7 /100 | #212 | Poor 93.4% |
| Immigrants | Asia | 15.7 /100 | #213 | Poor 93.4% |
| Immigrants | Bahamas | 15.2 /100 | #214 | Poor 93.4% |
| Immigrants | Oceania | 15.1 /100 | #215 | Poor 93.4% |
| Immigrants | Eastern Africa | 14.7 /100 | #216 | Poor 93.4% |
| Portuguese | 12.1 /100 | #217 | Poor 93.3% |
| Immigrants | Liberia | 10.2 /100 | #218 | Poor 93.3% |
| Seminole | 10.2 /100 | #219 | Poor 93.3% |
| Tongans | 9.5 /100 | #220 | Tragic 93.3% |
| Immigrants | Southern Europe | 8.9 /100 | #221 | Tragic 93.2% |
| Ethiopians | 7.9 /100 | #222 | Tragic 93.2% |
| Immigrants | Sierra Leone | 7.6 /100 | #223 | Tragic 93.2% |