Argentinean vs Immigrants from Netherlands 10th Grade
COMPARE
Argentinean
Immigrants from Netherlands
10th Grade
10th Grade Comparison
Argentineans
Immigrants from Netherlands
93.7%
10TH GRADE
50.0/ 100
METRIC RATING
174th/ 347
METRIC RANK
94.9%
10TH GRADE
99.7/ 100
METRIC RATING
67th/ 347
METRIC RANK
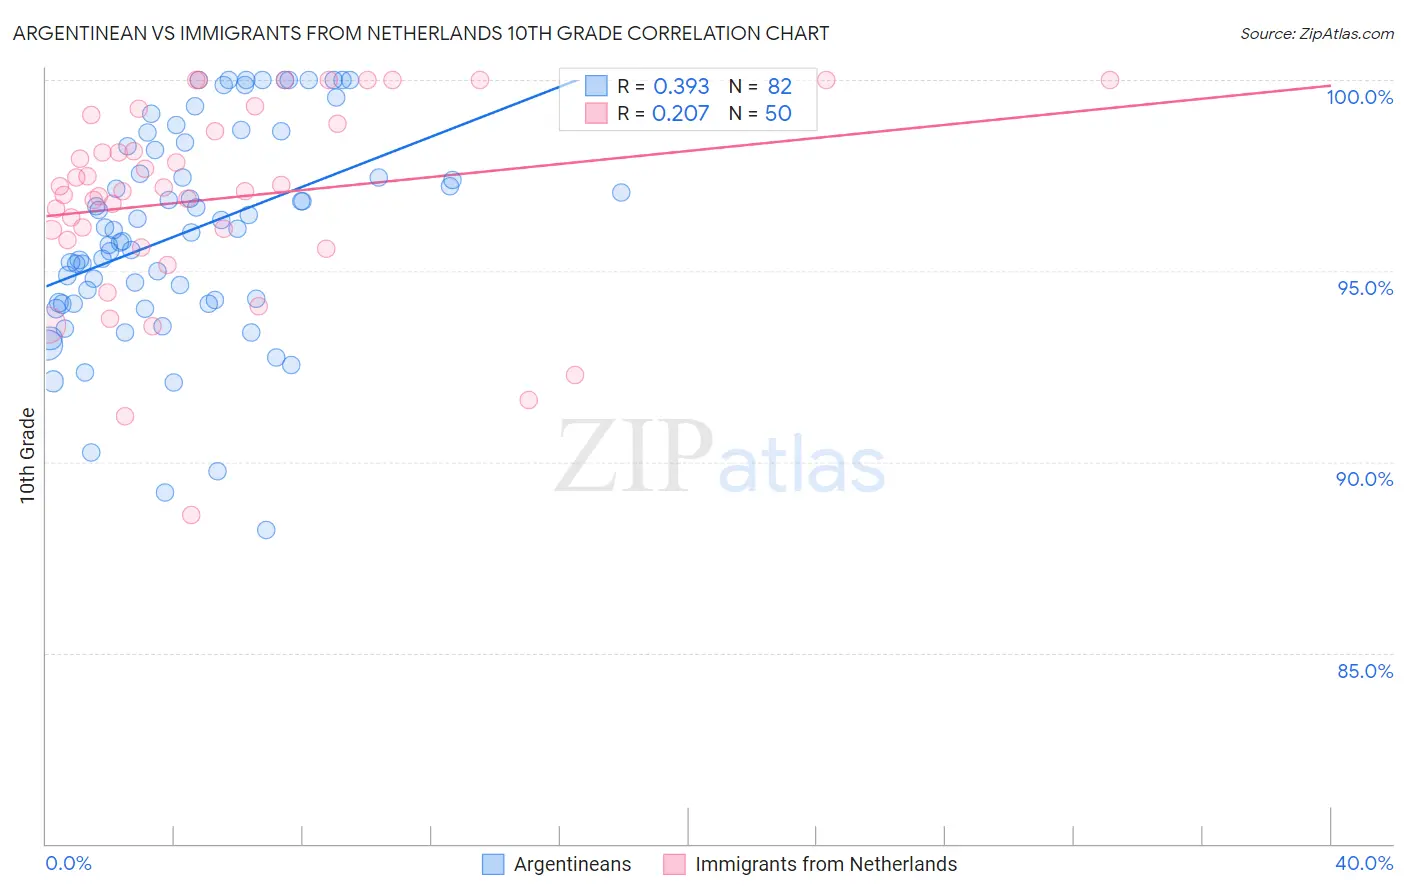
Argentinean vs Immigrants from Netherlands 10th Grade Correlation Chart
The statistical analysis conducted on geographies consisting of 297,145,104 people shows a mild positive correlation between the proportion of Argentineans and percentage of population with at least 10th grade education in the United States with a correlation coefficient (R) of 0.393 and weighted average of 93.7%. Similarly, the statistical analysis conducted on geographies consisting of 237,869,934 people shows a weak positive correlation between the proportion of Immigrants from Netherlands and percentage of population with at least 10th grade education in the United States with a correlation coefficient (R) of 0.207 and weighted average of 94.9%, a difference of 1.3%.
10th Grade Correlation Summary
| Measurement | Argentinean | Immigrants from Netherlands |
| Minimum | 88.2% | 88.6% |
| Maximum | 100.0% | 100.0% |
| Range | 11.8% | 11.4% |
| Mean | 96.0% | 96.9% |
| Median | 96.1% | 97.1% |
| Interquartile 25% (IQ1) | 94.2% | 95.8% |
| Interquartile 75% (IQ3) | 98.3% | 98.8% |
| Interquartile Range (IQR) | 4.1% | 3.0% |
| Standard Deviation (Sample) | 2.8% | 2.6% |
| Standard Deviation (Population) | 2.7% | 2.5% |
Similar Demographics by 10th Grade
Demographics Similar to Argentineans by 10th Grade
In terms of 10th grade, the demographic groups most similar to Argentineans are Spaniard (93.7%, a difference of 0.0%), Immigrants from Nepal (93.7%, a difference of 0.0%), French American Indian (93.7%, a difference of 0.010%), Immigrants from Albania (93.8%, a difference of 0.020%), and Immigrants from Venezuela (93.8%, a difference of 0.030%).
| Demographics | Rating | Rank | 10th Grade |
| Immigrants | Egypt | 62.3 /100 | #167 | Good 93.8% |
| Alsatians | 59.4 /100 | #168 | Average 93.8% |
| Immigrants | Spain | 55.9 /100 | #169 | Average 93.8% |
| Immigrants | Venezuela | 53.9 /100 | #170 | Average 93.8% |
| Immigrants | Albania | 52.4 /100 | #171 | Average 93.8% |
| French American Indians | 50.9 /100 | #172 | Average 93.7% |
| Spaniards | 50.3 /100 | #173 | Average 93.7% |
| Argentineans | 50.0 /100 | #174 | Average 93.7% |
| Immigrants | Nepal | 49.6 /100 | #175 | Average 93.7% |
| Immigrants | Argentina | 47.1 /100 | #176 | Average 93.7% |
| Immigrants | Lebanon | 47.1 /100 | #177 | Average 93.7% |
| Sierra Leoneans | 46.1 /100 | #178 | Average 93.7% |
| Paraguayans | 45.3 /100 | #179 | Average 93.7% |
| Blackfeet | 42.8 /100 | #180 | Average 93.7% |
| Immigrants | Northern Africa | 41.6 /100 | #181 | Average 93.7% |
Demographics Similar to Immigrants from Netherlands by 10th Grade
In terms of 10th grade, the demographic groups most similar to Immigrants from Netherlands are Immigrants from Australia (94.9%, a difference of 0.0%), Immigrants from Belgium (94.9%, a difference of 0.0%), Immigrants from England (94.9%, a difference of 0.020%), Zimbabwean (94.9%, a difference of 0.030%), and Alaska Native (94.9%, a difference of 0.030%).
| Demographics | Rating | Rank | 10th Grade |
| Cypriots | 99.8 /100 | #60 | Exceptional 95.0% |
| Chippewa | 99.8 /100 | #61 | Exceptional 95.0% |
| Thais | 99.8 /100 | #62 | Exceptional 95.0% |
| Immigrants | Singapore | 99.8 /100 | #63 | Exceptional 95.0% |
| Native Hawaiians | 99.7 /100 | #64 | Exceptional 95.0% |
| Turks | 99.7 /100 | #65 | Exceptional 95.0% |
| Immigrants | Australia | 99.7 /100 | #66 | Exceptional 94.9% |
| Immigrants | Netherlands | 99.7 /100 | #67 | Exceptional 94.9% |
| Immigrants | Belgium | 99.7 /100 | #68 | Exceptional 94.9% |
| Immigrants | England | 99.6 /100 | #69 | Exceptional 94.9% |
| Zimbabweans | 99.6 /100 | #70 | Exceptional 94.9% |
| Alaska Natives | 99.6 /100 | #71 | Exceptional 94.9% |
| Immigrants | Sweden | 99.6 /100 | #72 | Exceptional 94.9% |
| Bhutanese | 99.6 /100 | #73 | Exceptional 94.9% |
| Canadians | 99.6 /100 | #74 | Exceptional 94.9% |