Arapaho vs Ecuadorian College, Under 1 year
COMPARE
Arapaho
Ecuadorian
College, Under 1 year
College, Under 1 year Comparison
Arapaho
Ecuadorians
60.3%
COLLEGE, UNDER 1 YEAR
0.1/ 100
METRIC RATING
276th/ 347
METRIC RANK
59.3%
COLLEGE, UNDER 1 YEAR
0.0/ 100
METRIC RATING
290th/ 347
METRIC RANK
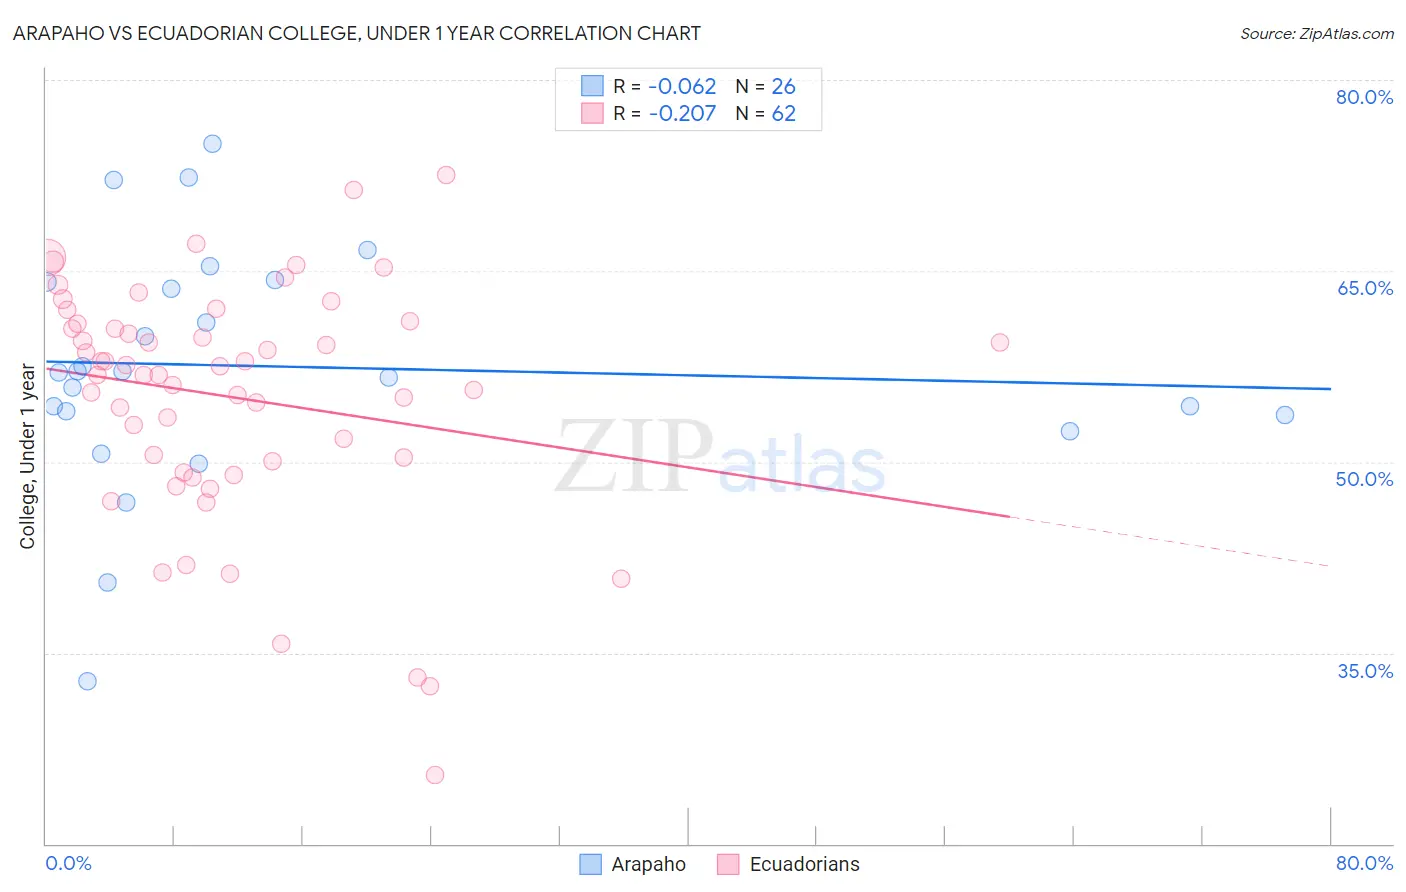
Arapaho vs Ecuadorian College, Under 1 year Correlation Chart
The statistical analysis conducted on geographies consisting of 29,780,040 people shows a slight negative correlation between the proportion of Arapaho and percentage of population with at least college, under 1 year education in the United States with a correlation coefficient (R) of -0.062 and weighted average of 60.3%. Similarly, the statistical analysis conducted on geographies consisting of 317,865,755 people shows a weak negative correlation between the proportion of Ecuadorians and percentage of population with at least college, under 1 year education in the United States with a correlation coefficient (R) of -0.207 and weighted average of 59.3%, a difference of 1.7%.
College, Under 1 year Correlation Summary
| Measurement | Arapaho | Ecuadorian |
| Minimum | 32.8% | 25.4% |
| Maximum | 75.0% | 72.5% |
| Range | 42.2% | 47.2% |
| Mean | 57.5% | 55.1% |
| Median | 57.1% | 57.2% |
| Interquartile 25% (IQ1) | 53.7% | 50.1% |
| Interquartile 75% (IQ3) | 64.1% | 60.9% |
| Interquartile Range (IQR) | 10.4% | 10.8% |
| Standard Deviation (Sample) | 9.4% | 9.4% |
| Standard Deviation (Population) | 9.3% | 9.3% |
Demographics Similar to Arapaho and Ecuadorians by College, Under 1 year
In terms of college, under 1 year, the demographic groups most similar to Arapaho are Immigrants from Barbados (60.4%, a difference of 0.030%), Bahamian (60.3%, a difference of 0.14%), Chickasaw (60.4%, a difference of 0.16%), Alaska Native (60.4%, a difference of 0.16%), and Yaqui (60.2%, a difference of 0.17%). Similarly, the demographic groups most similar to Ecuadorians are Choctaw (59.3%, a difference of 0.040%), Creek (59.3%, a difference of 0.090%), Black/African American (59.4%, a difference of 0.11%), Nicaraguan (59.2%, a difference of 0.13%), and Sioux (59.4%, a difference of 0.21%).
| Demographics | Rating | Rank | College, Under 1 year |
| Chickasaw | 0.1 /100 | #273 | Tragic 60.4% |
| Alaska Natives | 0.1 /100 | #274 | Tragic 60.4% |
| Immigrants | Barbados | 0.1 /100 | #275 | Tragic 60.4% |
| Arapaho | 0.1 /100 | #276 | Tragic 60.3% |
| Bahamians | 0.1 /100 | #277 | Tragic 60.3% |
| Yaqui | 0.1 /100 | #278 | Tragic 60.2% |
| Ute | 0.1 /100 | #279 | Tragic 60.2% |
| Crow | 0.1 /100 | #280 | Tragic 60.2% |
| Cherokee | 0.1 /100 | #281 | Tragic 60.1% |
| Belizeans | 0.1 /100 | #282 | Tragic 60.1% |
| Immigrants | Jamaica | 0.0 /100 | #283 | Tragic 59.7% |
| Immigrants | St. Vincent and the Grenadines | 0.0 /100 | #284 | Tragic 59.6% |
| Paiute | 0.0 /100 | #285 | Tragic 59.6% |
| British West Indians | 0.0 /100 | #286 | Tragic 59.5% |
| Sioux | 0.0 /100 | #287 | Tragic 59.4% |
| Blacks/African Americans | 0.0 /100 | #288 | Tragic 59.4% |
| Choctaw | 0.0 /100 | #289 | Tragic 59.3% |
| Ecuadorians | 0.0 /100 | #290 | Tragic 59.3% |
| Creek | 0.0 /100 | #291 | Tragic 59.3% |
| Nicaraguans | 0.0 /100 | #292 | Tragic 59.2% |
| Seminole | 0.0 /100 | #293 | Tragic 59.1% |