Arapaho vs Nepalese College, Under 1 year
COMPARE
Arapaho
Nepalese
College, Under 1 year
College, Under 1 year Comparison
Arapaho
Nepalese
60.3%
COLLEGE, UNDER 1 YEAR
0.1/ 100
METRIC RATING
276th/ 347
METRIC RANK
62.2%
COLLEGE, UNDER 1 YEAR
1.1/ 100
METRIC RATING
239th/ 347
METRIC RANK
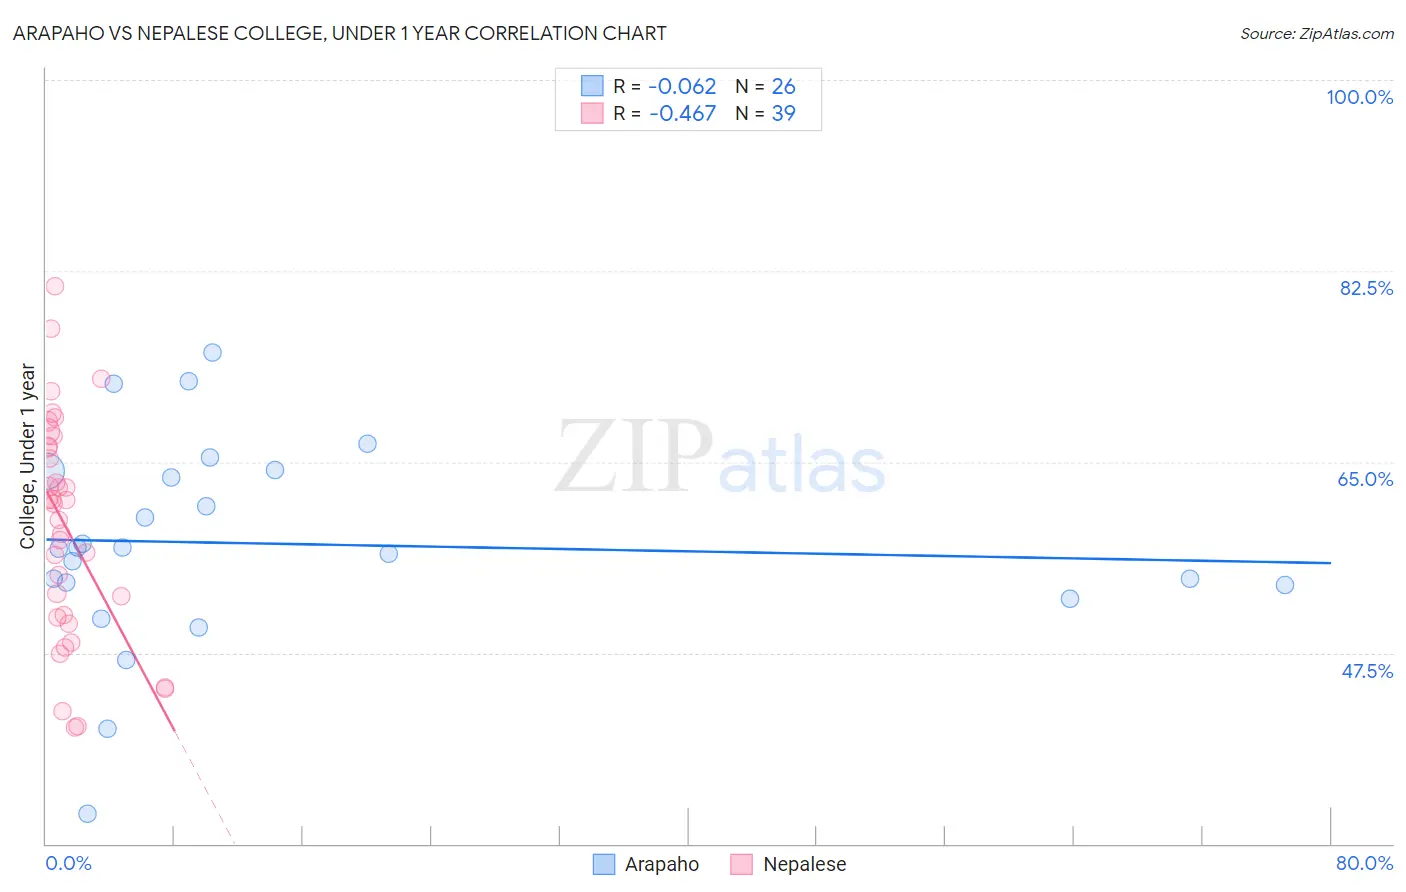
Arapaho vs Nepalese College, Under 1 year Correlation Chart
The statistical analysis conducted on geographies consisting of 29,780,040 people shows a slight negative correlation between the proportion of Arapaho and percentage of population with at least college, under 1 year education in the United States with a correlation coefficient (R) of -0.062 and weighted average of 60.3%. Similarly, the statistical analysis conducted on geographies consisting of 24,519,269 people shows a moderate negative correlation between the proportion of Nepalese and percentage of population with at least college, under 1 year education in the United States with a correlation coefficient (R) of -0.467 and weighted average of 62.2%, a difference of 3.1%.
College, Under 1 year Correlation Summary
| Measurement | Arapaho | Nepalese |
| Minimum | 32.8% | 40.7% |
| Maximum | 75.0% | 81.1% |
| Range | 42.2% | 40.5% |
| Mean | 57.5% | 58.9% |
| Median | 57.1% | 61.2% |
| Interquartile 25% (IQ1) | 53.7% | 50.7% |
| Interquartile 75% (IQ3) | 64.1% | 66.4% |
| Interquartile Range (IQR) | 10.4% | 15.7% |
| Standard Deviation (Sample) | 9.4% | 10.2% |
| Standard Deviation (Population) | 9.3% | 10.0% |
Similar Demographics by College, Under 1 year
Demographics Similar to Arapaho by College, Under 1 year
In terms of college, under 1 year, the demographic groups most similar to Arapaho are Immigrants from Barbados (60.4%, a difference of 0.030%), Bahamian (60.3%, a difference of 0.14%), Chickasaw (60.4%, a difference of 0.16%), Alaska Native (60.4%, a difference of 0.16%), and Yaqui (60.2%, a difference of 0.17%).
| Demographics | Rating | Rank | College, Under 1 year |
| Immigrants | West Indies | 0.1 /100 | #269 | Tragic 60.6% |
| Cheyenne | 0.1 /100 | #270 | Tragic 60.6% |
| U.S. Virgin Islanders | 0.1 /100 | #271 | Tragic 60.6% |
| Jamaicans | 0.1 /100 | #272 | Tragic 60.5% |
| Chickasaw | 0.1 /100 | #273 | Tragic 60.4% |
| Alaska Natives | 0.1 /100 | #274 | Tragic 60.4% |
| Immigrants | Barbados | 0.1 /100 | #275 | Tragic 60.4% |
| Arapaho | 0.1 /100 | #276 | Tragic 60.3% |
| Bahamians | 0.1 /100 | #277 | Tragic 60.3% |
| Yaqui | 0.1 /100 | #278 | Tragic 60.2% |
| Ute | 0.1 /100 | #279 | Tragic 60.2% |
| Crow | 0.1 /100 | #280 | Tragic 60.2% |
| Cherokee | 0.1 /100 | #281 | Tragic 60.1% |
| Belizeans | 0.1 /100 | #282 | Tragic 60.1% |
| Immigrants | Jamaica | 0.0 /100 | #283 | Tragic 59.7% |
Demographics Similar to Nepalese by College, Under 1 year
In terms of college, under 1 year, the demographic groups most similar to Nepalese are Aleut (62.2%, a difference of 0.0%), Ottawa (62.2%, a difference of 0.010%), Malaysian (62.2%, a difference of 0.060%), Hawaiian (62.1%, a difference of 0.090%), and Colville (62.1%, a difference of 0.18%).
| Demographics | Rating | Rank | College, Under 1 year |
| Osage | 2.2 /100 | #232 | Tragic 62.7% |
| Iroquois | 2.0 /100 | #233 | Tragic 62.6% |
| Chippewa | 2.0 /100 | #234 | Tragic 62.6% |
| Spanish Americans | 1.9 /100 | #235 | Tragic 62.6% |
| Immigrants | Immigrants | 1.7 /100 | #236 | Tragic 62.5% |
| Immigrants | Burma/Myanmar | 1.6 /100 | #237 | Tragic 62.5% |
| French American Indians | 1.5 /100 | #238 | Tragic 62.4% |
| Nepalese | 1.1 /100 | #239 | Tragic 62.2% |
| Aleuts | 1.1 /100 | #240 | Tragic 62.2% |
| Ottawa | 1.1 /100 | #241 | Tragic 62.2% |
| Malaysians | 1.1 /100 | #242 | Tragic 62.2% |
| Hawaiians | 1.1 /100 | #243 | Tragic 62.1% |
| Colville | 1.0 /100 | #244 | Tragic 62.1% |
| Delaware | 0.9 /100 | #245 | Tragic 62.1% |
| Marshallese | 0.8 /100 | #246 | Tragic 61.9% |