Immigrants from Singapore vs Nepalese Associate's Degree
COMPARE
Immigrants from Singapore
Nepalese
Associate's Degree
Associate's Degree Comparison
Immigrants from Singapore
Nepalese
58.9%
ASSOCIATE'S DEGREE
100.0/ 100
METRIC RATING
2nd/ 347
METRIC RANK
39.0%
ASSOCIATE'S DEGREE
0.0/ 100
METRIC RATING
293rd/ 347
METRIC RANK
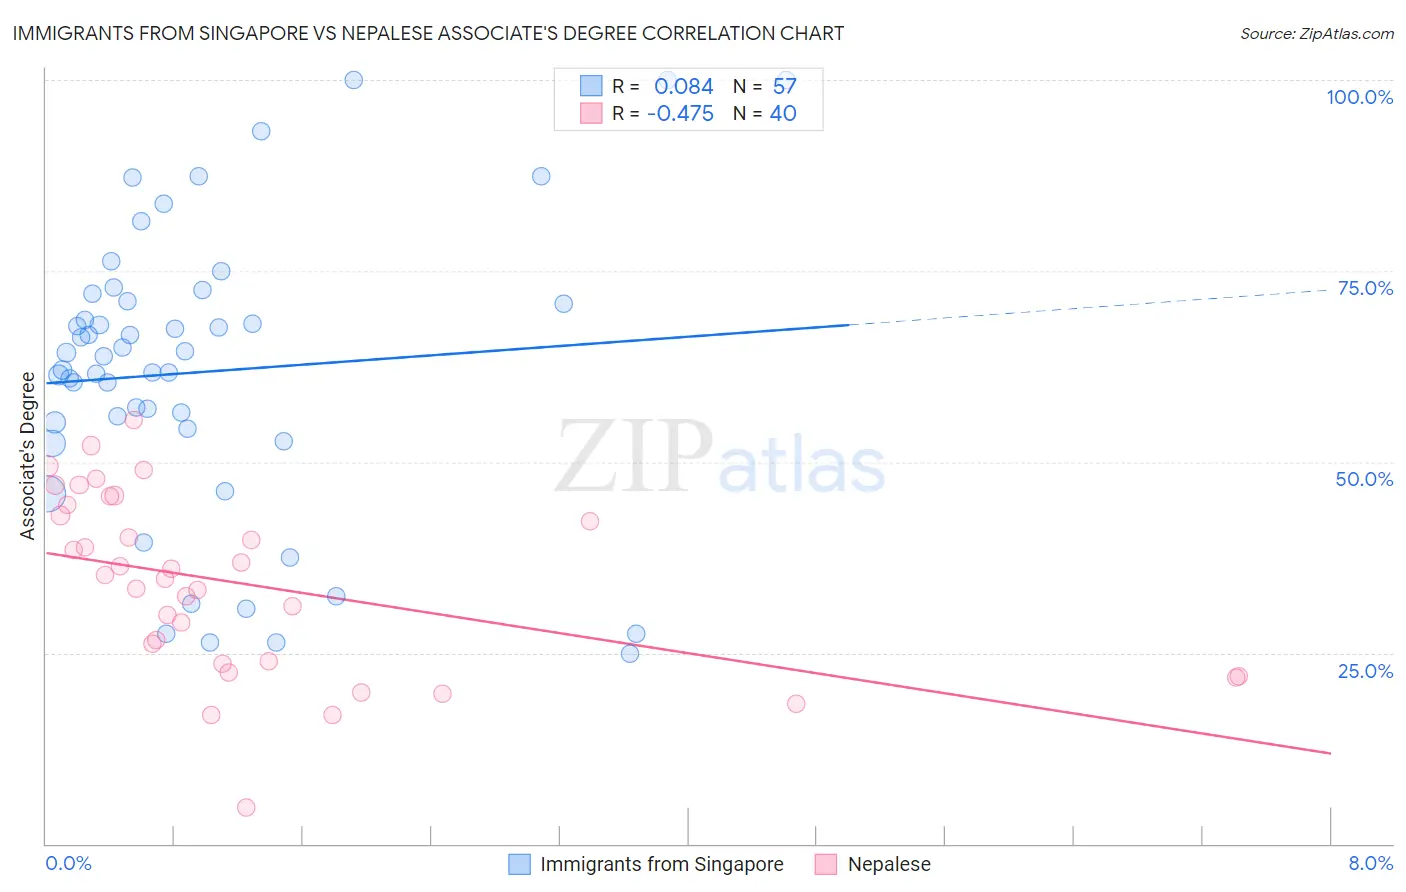
Immigrants from Singapore vs Nepalese Associate's Degree Correlation Chart
The statistical analysis conducted on geographies consisting of 137,518,167 people shows a slight positive correlation between the proportion of Immigrants from Singapore and percentage of population with at least associate's degree education in the United States with a correlation coefficient (R) of 0.084 and weighted average of 58.9%. Similarly, the statistical analysis conducted on geographies consisting of 24,521,755 people shows a moderate negative correlation between the proportion of Nepalese and percentage of population with at least associate's degree education in the United States with a correlation coefficient (R) of -0.475 and weighted average of 39.0%, a difference of 50.9%.
Associate's Degree Correlation Summary
| Measurement | Immigrants from Singapore | Nepalese |
| Minimum | 24.9% | 4.8% |
| Maximum | 100.0% | 55.5% |
| Range | 75.1% | 50.8% |
| Mean | 61.8% | 33.9% |
| Median | 63.8% | 35.0% |
| Interquartile 25% (IQ1) | 53.5% | 23.7% |
| Interquartile 75% (IQ3) | 71.5% | 43.7% |
| Interquartile Range (IQR) | 18.1% | 20.0% |
| Standard Deviation (Sample) | 19.1% | 11.7% |
| Standard Deviation (Population) | 18.9% | 11.6% |
Similar Demographics by Associate's Degree
Demographics Similar to Immigrants from Singapore by Associate's Degree
In terms of associate's degree, the demographic groups most similar to Immigrants from Singapore are Immigrants from India (58.5%, a difference of 0.66%), Immigrants from Taiwan (58.4%, a difference of 0.91%), Iranian (58.2%, a difference of 1.3%), Filipino (59.8%, a difference of 1.5%), and Okinawan (57.7%, a difference of 2.2%).
| Demographics | Rating | Rank | Associate's Degree |
| Filipinos | 100.0 /100 | #1 | Exceptional 59.8% |
| Immigrants | Singapore | 100.0 /100 | #2 | Exceptional 58.9% |
| Immigrants | India | 100.0 /100 | #3 | Exceptional 58.5% |
| Immigrants | Taiwan | 100.0 /100 | #4 | Exceptional 58.4% |
| Iranians | 100.0 /100 | #5 | Exceptional 58.2% |
| Okinawans | 100.0 /100 | #6 | Exceptional 57.7% |
| Immigrants | Iran | 100.0 /100 | #7 | Exceptional 57.7% |
| Thais | 100.0 /100 | #8 | Exceptional 57.4% |
| Immigrants | Israel | 100.0 /100 | #9 | Exceptional 56.8% |
| Cypriots | 100.0 /100 | #10 | Exceptional 56.4% |
| Immigrants | Australia | 100.0 /100 | #11 | Exceptional 55.8% |
| Immigrants | South Central Asia | 100.0 /100 | #12 | Exceptional 55.7% |
| Immigrants | China | 100.0 /100 | #13 | Exceptional 55.5% |
| Immigrants | Hong Kong | 100.0 /100 | #14 | Exceptional 55.4% |
| Immigrants | Eastern Asia | 100.0 /100 | #15 | Exceptional 55.4% |
Demographics Similar to Nepalese by Associate's Degree
In terms of associate's degree, the demographic groups most similar to Nepalese are Salvadoran (39.0%, a difference of 0.0%), Black/African American (39.1%, a difference of 0.25%), Honduran (38.9%, a difference of 0.29%), Cherokee (38.9%, a difference of 0.46%), and Dominican (39.3%, a difference of 0.54%).
| Demographics | Rating | Rank | Associate's Degree |
| Immigrants | Caribbean | 0.0 /100 | #286 | Tragic 39.7% |
| Aleuts | 0.0 /100 | #287 | Tragic 39.6% |
| Immigrants | Cuba | 0.0 /100 | #288 | Tragic 39.5% |
| Central Americans | 0.0 /100 | #289 | Tragic 39.4% |
| Immigrants | Haiti | 0.0 /100 | #290 | Tragic 39.3% |
| Dominicans | 0.0 /100 | #291 | Tragic 39.3% |
| Blacks/African Americans | 0.0 /100 | #292 | Tragic 39.1% |
| Nepalese | 0.0 /100 | #293 | Tragic 39.0% |
| Salvadorans | 0.0 /100 | #294 | Tragic 39.0% |
| Hondurans | 0.0 /100 | #295 | Tragic 38.9% |
| Cherokee | 0.0 /100 | #296 | Tragic 38.9% |
| Cape Verdeans | 0.0 /100 | #297 | Tragic 38.8% |
| Cheyenne | 0.0 /100 | #298 | Tragic 38.7% |
| Ute | 0.0 /100 | #299 | Tragic 38.6% |
| Chickasaw | 0.0 /100 | #300 | Tragic 38.6% |