Immigrants from Central America vs Nepalese Associate's Degree
COMPARE
Immigrants from Central America
Nepalese
Associate's Degree
Associate's Degree Comparison
Immigrants from Central America
Nepalese
35.0%
ASSOCIATE'S DEGREE
0.0/ 100
METRIC RATING
332nd/ 347
METRIC RANK
39.0%
ASSOCIATE'S DEGREE
0.0/ 100
METRIC RATING
293rd/ 347
METRIC RANK
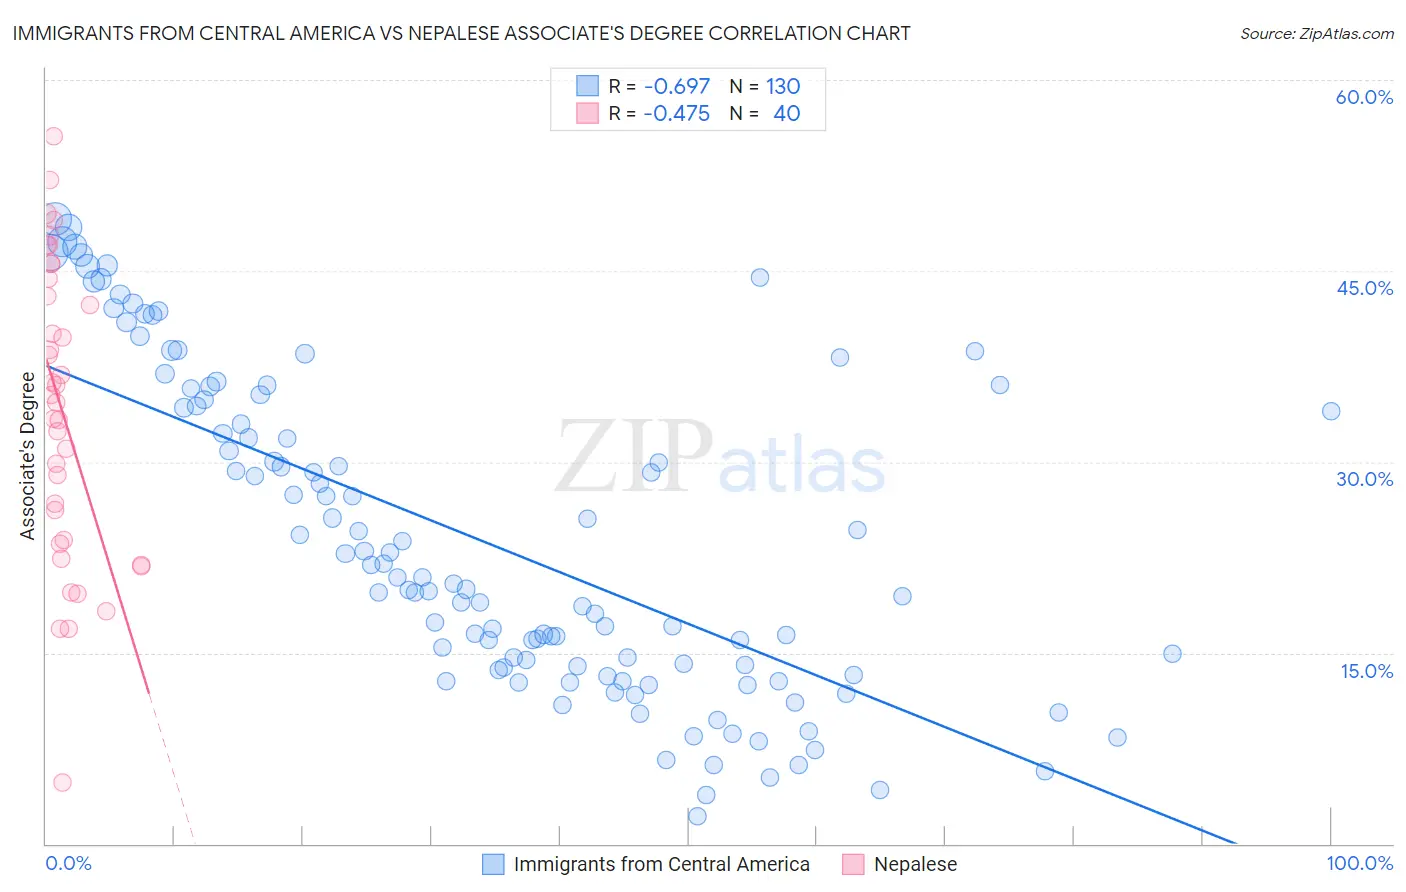
Immigrants from Central America vs Nepalese Associate's Degree Correlation Chart
The statistical analysis conducted on geographies consisting of 536,468,789 people shows a significant negative correlation between the proportion of Immigrants from Central America and percentage of population with at least associate's degree education in the United States with a correlation coefficient (R) of -0.697 and weighted average of 35.0%. Similarly, the statistical analysis conducted on geographies consisting of 24,521,755 people shows a moderate negative correlation between the proportion of Nepalese and percentage of population with at least associate's degree education in the United States with a correlation coefficient (R) of -0.475 and weighted average of 39.0%, a difference of 11.5%.
Associate's Degree Correlation Summary
| Measurement | Immigrants from Central America | Nepalese |
| Minimum | 2.2% | 4.8% |
| Maximum | 49.1% | 55.5% |
| Range | 46.9% | 50.8% |
| Mean | 23.8% | 33.9% |
| Median | 20.7% | 35.0% |
| Interquartile 25% (IQ1) | 13.9% | 23.7% |
| Interquartile 75% (IQ3) | 34.4% | 43.7% |
| Interquartile Range (IQR) | 20.5% | 20.0% |
| Standard Deviation (Sample) | 12.4% | 11.7% |
| Standard Deviation (Population) | 12.4% | 11.6% |
Similar Demographics by Associate's Degree
Demographics Similar to Immigrants from Central America by Associate's Degree
In terms of associate's degree, the demographic groups most similar to Immigrants from Central America are Mexican (35.0%, a difference of 0.080%), Native/Alaskan (34.9%, a difference of 0.31%), Spanish American Indian (34.9%, a difference of 0.45%), Hopi (34.6%, a difference of 1.3%), and Immigrants from the Azores (35.6%, a difference of 1.8%).
| Demographics | Rating | Rank | Associate's Degree |
| Menominee | 0.0 /100 | #325 | Tragic 36.7% |
| Kiowa | 0.0 /100 | #326 | Tragic 36.5% |
| Dutch West Indians | 0.0 /100 | #327 | Tragic 36.5% |
| Alaskan Athabascans | 0.0 /100 | #328 | Tragic 36.5% |
| Paiute | 0.0 /100 | #329 | Tragic 36.4% |
| Apache | 0.0 /100 | #330 | Tragic 36.2% |
| Immigrants | Azores | 0.0 /100 | #331 | Tragic 35.6% |
| Immigrants | Central America | 0.0 /100 | #332 | Tragic 35.0% |
| Mexicans | 0.0 /100 | #333 | Tragic 35.0% |
| Natives/Alaskans | 0.0 /100 | #334 | Tragic 34.9% |
| Spanish American Indians | 0.0 /100 | #335 | Tragic 34.9% |
| Hopi | 0.0 /100 | #336 | Tragic 34.6% |
| Lumbee | 0.0 /100 | #337 | Tragic 34.1% |
| Pueblo | 0.0 /100 | #338 | Tragic 34.0% |
| Immigrants | Mexico | 0.0 /100 | #339 | Tragic 33.7% |
Demographics Similar to Nepalese by Associate's Degree
In terms of associate's degree, the demographic groups most similar to Nepalese are Salvadoran (39.0%, a difference of 0.0%), Black/African American (39.1%, a difference of 0.25%), Honduran (38.9%, a difference of 0.29%), Cherokee (38.9%, a difference of 0.46%), and Dominican (39.3%, a difference of 0.54%).
| Demographics | Rating | Rank | Associate's Degree |
| Immigrants | Caribbean | 0.0 /100 | #286 | Tragic 39.7% |
| Aleuts | 0.0 /100 | #287 | Tragic 39.6% |
| Immigrants | Cuba | 0.0 /100 | #288 | Tragic 39.5% |
| Central Americans | 0.0 /100 | #289 | Tragic 39.4% |
| Immigrants | Haiti | 0.0 /100 | #290 | Tragic 39.3% |
| Dominicans | 0.0 /100 | #291 | Tragic 39.3% |
| Blacks/African Americans | 0.0 /100 | #292 | Tragic 39.1% |
| Nepalese | 0.0 /100 | #293 | Tragic 39.0% |
| Salvadorans | 0.0 /100 | #294 | Tragic 39.0% |
| Hondurans | 0.0 /100 | #295 | Tragic 38.9% |
| Cherokee | 0.0 /100 | #296 | Tragic 38.9% |
| Cape Verdeans | 0.0 /100 | #297 | Tragic 38.8% |
| Cheyenne | 0.0 /100 | #298 | Tragic 38.7% |
| Ute | 0.0 /100 | #299 | Tragic 38.6% |
| Chickasaw | 0.0 /100 | #300 | Tragic 38.6% |