Immigrants from Morocco vs Nepalese Associate's Degree
COMPARE
Immigrants from Morocco
Nepalese
Associate's Degree
Associate's Degree Comparison
Immigrants from Morocco
Nepalese
49.2%
ASSOCIATE'S DEGREE
96.3/ 100
METRIC RATING
109th/ 347
METRIC RANK
39.0%
ASSOCIATE'S DEGREE
0.0/ 100
METRIC RATING
293rd/ 347
METRIC RANK
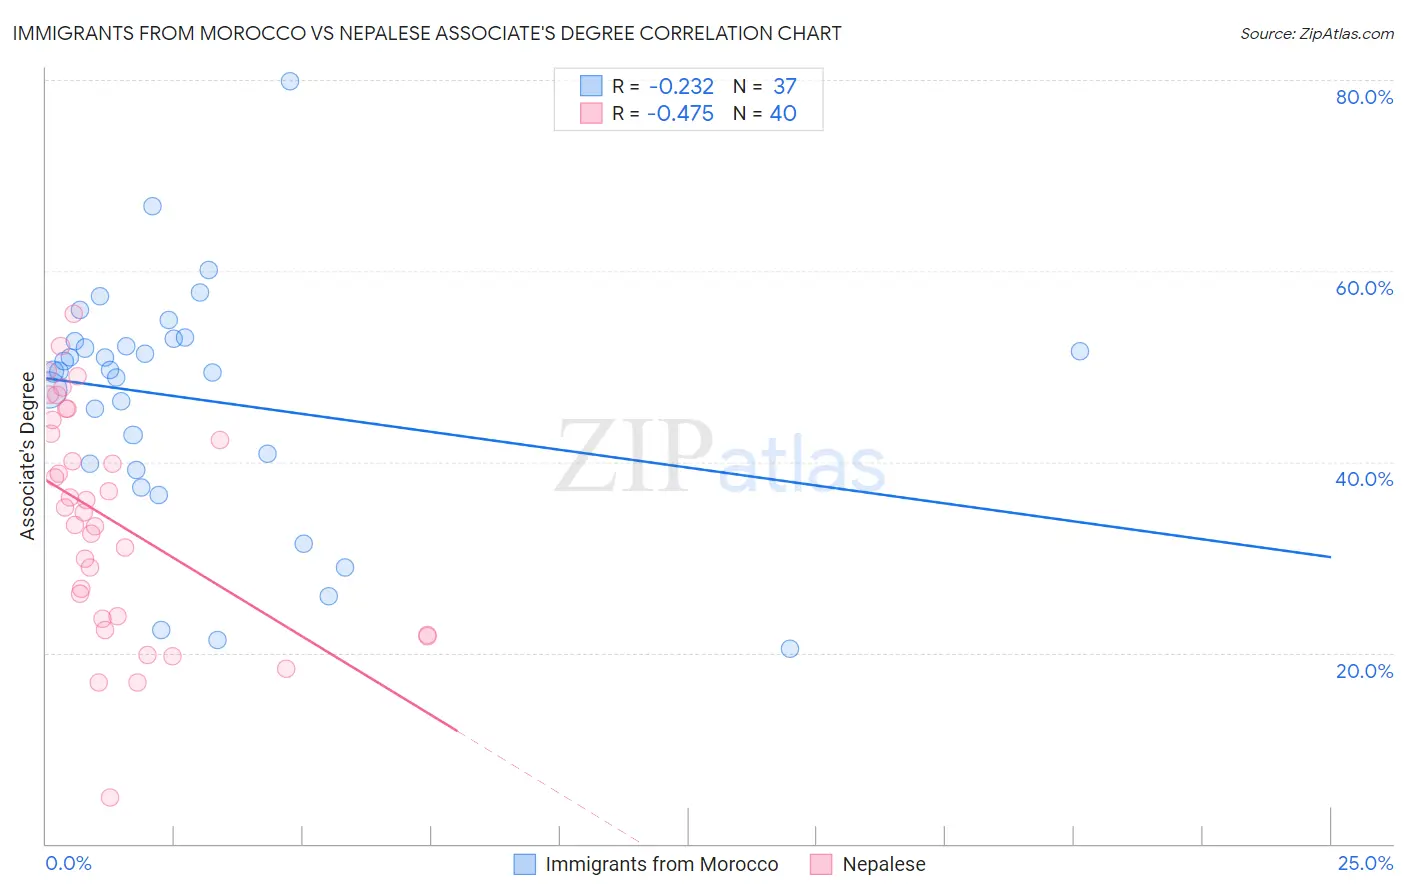
Immigrants from Morocco vs Nepalese Associate's Degree Correlation Chart
The statistical analysis conducted on geographies consisting of 178,912,438 people shows a weak negative correlation between the proportion of Immigrants from Morocco and percentage of population with at least associate's degree education in the United States with a correlation coefficient (R) of -0.232 and weighted average of 49.2%. Similarly, the statistical analysis conducted on geographies consisting of 24,521,755 people shows a moderate negative correlation between the proportion of Nepalese and percentage of population with at least associate's degree education in the United States with a correlation coefficient (R) of -0.475 and weighted average of 39.0%, a difference of 26.0%.
Associate's Degree Correlation Summary
| Measurement | Immigrants from Morocco | Nepalese |
| Minimum | 20.4% | 4.8% |
| Maximum | 79.9% | 55.5% |
| Range | 59.4% | 50.8% |
| Mean | 46.6% | 33.9% |
| Median | 49.4% | 35.0% |
| Interquartile 25% (IQ1) | 39.4% | 23.7% |
| Interquartile 75% (IQ3) | 52.8% | 43.7% |
| Interquartile Range (IQR) | 13.4% | 20.0% |
| Standard Deviation (Sample) | 12.5% | 11.7% |
| Standard Deviation (Population) | 12.3% | 11.6% |
Similar Demographics by Associate's Degree
Demographics Similar to Immigrants from Morocco by Associate's Degree
In terms of associate's degree, the demographic groups most similar to Immigrants from Morocco are Jordanian (49.2%, a difference of 0.13%), Syrian (49.3%, a difference of 0.20%), Austrian (49.1%, a difference of 0.22%), Croatian (49.3%, a difference of 0.23%), and Immigrants from Italy (49.3%, a difference of 0.23%).
| Demographics | Rating | Rank | Associate's Degree |
| Chileans | 97.3 /100 | #102 | Exceptional 49.4% |
| Ukrainians | 97.1 /100 | #103 | Exceptional 49.4% |
| Venezuelans | 97.0 /100 | #104 | Exceptional 49.4% |
| Croatians | 96.8 /100 | #105 | Exceptional 49.3% |
| Immigrants | Italy | 96.7 /100 | #106 | Exceptional 49.3% |
| Syrians | 96.7 /100 | #107 | Exceptional 49.3% |
| Jordanians | 96.6 /100 | #108 | Exceptional 49.2% |
| Immigrants | Morocco | 96.3 /100 | #109 | Exceptional 49.2% |
| Austrians | 95.8 /100 | #110 | Exceptional 49.1% |
| Immigrants | Venezuela | 95.8 /100 | #111 | Exceptional 49.1% |
| Immigrants | Chile | 95.3 /100 | #112 | Exceptional 49.0% |
| Palestinians | 95.3 /100 | #113 | Exceptional 49.0% |
| Arabs | 95.3 /100 | #114 | Exceptional 49.0% |
| Luxembourgers | 95.1 /100 | #115 | Exceptional 48.9% |
| British | 95.0 /100 | #116 | Exceptional 48.9% |
Demographics Similar to Nepalese by Associate's Degree
In terms of associate's degree, the demographic groups most similar to Nepalese are Salvadoran (39.0%, a difference of 0.0%), Black/African American (39.1%, a difference of 0.25%), Honduran (38.9%, a difference of 0.29%), Cherokee (38.9%, a difference of 0.46%), and Dominican (39.3%, a difference of 0.54%).
| Demographics | Rating | Rank | Associate's Degree |
| Immigrants | Caribbean | 0.0 /100 | #286 | Tragic 39.7% |
| Aleuts | 0.0 /100 | #287 | Tragic 39.6% |
| Immigrants | Cuba | 0.0 /100 | #288 | Tragic 39.5% |
| Central Americans | 0.0 /100 | #289 | Tragic 39.4% |
| Immigrants | Haiti | 0.0 /100 | #290 | Tragic 39.3% |
| Dominicans | 0.0 /100 | #291 | Tragic 39.3% |
| Blacks/African Americans | 0.0 /100 | #292 | Tragic 39.1% |
| Nepalese | 0.0 /100 | #293 | Tragic 39.0% |
| Salvadorans | 0.0 /100 | #294 | Tragic 39.0% |
| Hondurans | 0.0 /100 | #295 | Tragic 38.9% |
| Cherokee | 0.0 /100 | #296 | Tragic 38.9% |
| Cape Verdeans | 0.0 /100 | #297 | Tragic 38.8% |
| Cheyenne | 0.0 /100 | #298 | Tragic 38.7% |
| Ute | 0.0 /100 | #299 | Tragic 38.6% |
| Chickasaw | 0.0 /100 | #300 | Tragic 38.6% |