Immigrants from West Indies vs Marshallese Associate's Degree
COMPARE
Immigrants from West Indies
Marshallese
Associate's Degree
Associate's Degree Comparison
Immigrants from West Indies
Marshallese
42.4%
ASSOCIATE'S DEGREE
1.0/ 100
METRIC RATING
242nd/ 347
METRIC RANK
41.6%
ASSOCIATE'S DEGREE
0.4/ 100
METRIC RATING
260th/ 347
METRIC RANK
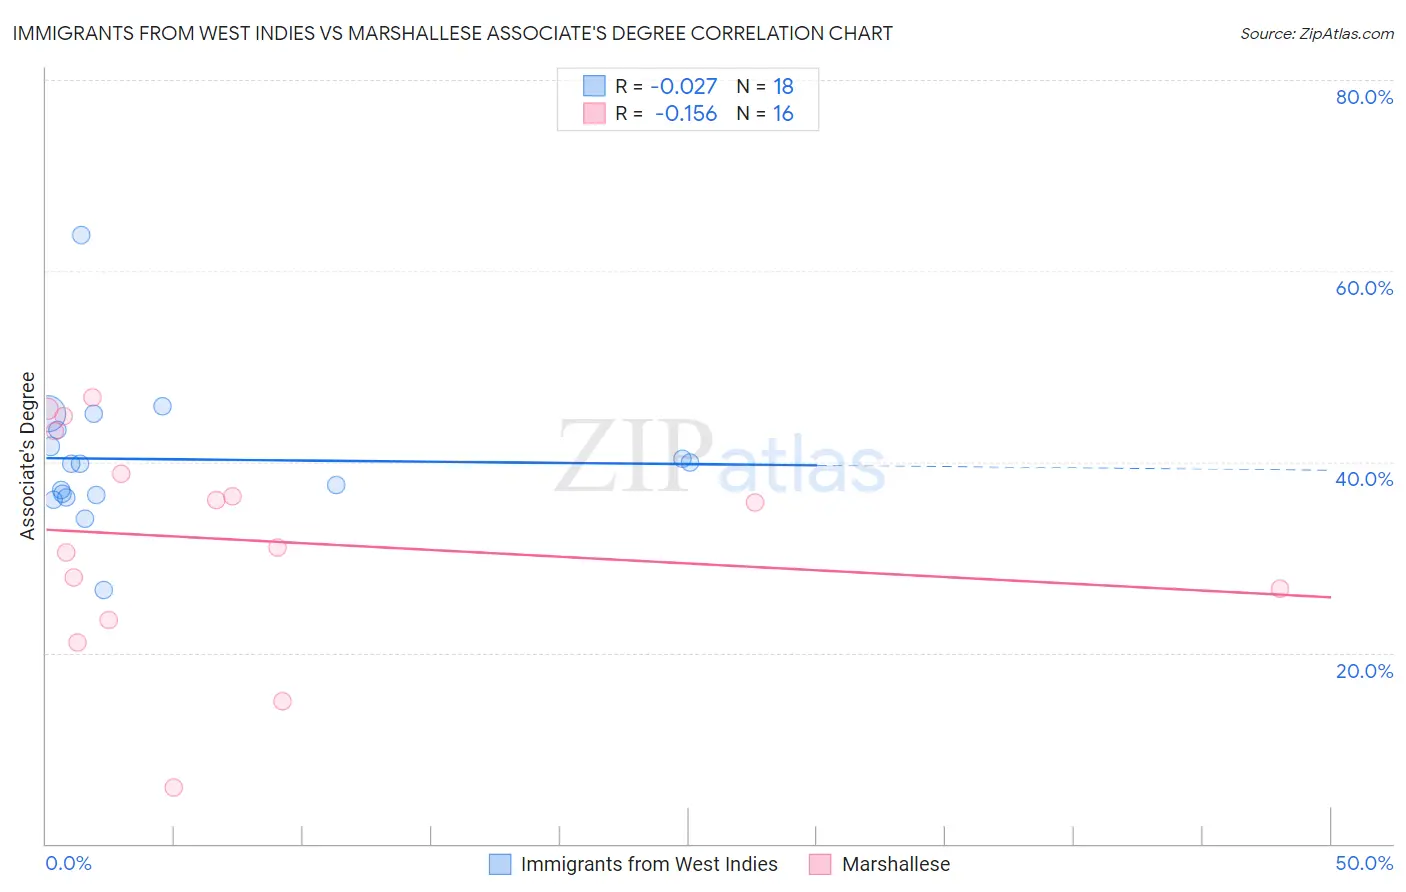
Immigrants from West Indies vs Marshallese Associate's Degree Correlation Chart
The statistical analysis conducted on geographies consisting of 72,420,477 people shows no correlation between the proportion of Immigrants from West Indies and percentage of population with at least associate's degree education in the United States with a correlation coefficient (R) of -0.027 and weighted average of 42.4%. Similarly, the statistical analysis conducted on geographies consisting of 14,761,315 people shows a poor negative correlation between the proportion of Marshallese and percentage of population with at least associate's degree education in the United States with a correlation coefficient (R) of -0.156 and weighted average of 41.6%, a difference of 2.0%.
Associate's Degree Correlation Summary
| Measurement | Immigrants from West Indies | Marshallese |
| Minimum | 26.6% | 5.9% |
| Maximum | 63.8% | 46.8% |
| Range | 37.2% | 40.9% |
| Mean | 40.3% | 31.8% |
| Median | 39.8% | 33.4% |
| Interquartile 25% (IQ1) | 36.5% | 25.1% |
| Interquartile 75% (IQ3) | 43.4% | 41.0% |
| Interquartile Range (IQR) | 6.9% | 15.9% |
| Standard Deviation (Sample) | 7.5% | 11.5% |
| Standard Deviation (Population) | 7.2% | 11.2% |
Demographics Similar to Immigrants from West Indies and Marshallese by Associate's Degree
In terms of associate's degree, the demographic groups most similar to Immigrants from West Indies are British West Indian (42.4%, a difference of 0.010%), Guyanese (42.3%, a difference of 0.11%), Immigrants from Liberia (42.3%, a difference of 0.25%), Immigrants from Cambodia (42.3%, a difference of 0.27%), and Delaware (42.3%, a difference of 0.30%). Similarly, the demographic groups most similar to Marshallese are Nicaraguan (41.5%, a difference of 0.13%), Malaysian (41.6%, a difference of 0.19%), Japanese (41.7%, a difference of 0.30%), Spanish American (41.8%, a difference of 0.51%), and Immigrants from Congo (41.8%, a difference of 0.57%).
| Demographics | Rating | Rank | Associate's Degree |
| British West Indians | 1.0 /100 | #241 | Tragic 42.4% |
| Immigrants | West Indies | 1.0 /100 | #242 | Tragic 42.4% |
| Guyanese | 1.0 /100 | #243 | Tragic 42.3% |
| Immigrants | Liberia | 0.9 /100 | #244 | Tragic 42.3% |
| Immigrants | Cambodia | 0.9 /100 | #245 | Tragic 42.3% |
| Delaware | 0.9 /100 | #246 | Tragic 42.3% |
| Immigrants | Fiji | 0.8 /100 | #247 | Tragic 42.2% |
| Immigrants | Ecuador | 0.8 /100 | #248 | Tragic 42.2% |
| Jamaicans | 0.7 /100 | #249 | Tragic 42.1% |
| U.S. Virgin Islanders | 0.7 /100 | #250 | Tragic 42.1% |
| Immigrants | Bahamas | 0.7 /100 | #251 | Tragic 42.1% |
| French American Indians | 0.6 /100 | #252 | Tragic 42.0% |
| Indonesians | 0.6 /100 | #253 | Tragic 41.9% |
| Cubans | 0.6 /100 | #254 | Tragic 41.9% |
| Immigrants | Guyana | 0.5 /100 | #255 | Tragic 41.8% |
| Immigrants | Congo | 0.5 /100 | #256 | Tragic 41.8% |
| Spanish Americans | 0.5 /100 | #257 | Tragic 41.8% |
| Japanese | 0.5 /100 | #258 | Tragic 41.7% |
| Malaysians | 0.4 /100 | #259 | Tragic 41.6% |
| Marshallese | 0.4 /100 | #260 | Tragic 41.6% |
| Nicaraguans | 0.4 /100 | #261 | Tragic 41.5% |