Apache vs Malaysian College, Under 1 year
COMPARE
Apache
Malaysian
College, Under 1 year
College, Under 1 year Comparison
Apache
Malaysians
58.0%
COLLEGE, UNDER 1 YEAR
0.0/ 100
METRIC RATING
302nd/ 347
METRIC RANK
62.2%
COLLEGE, UNDER 1 YEAR
1.1/ 100
METRIC RATING
242nd/ 347
METRIC RANK
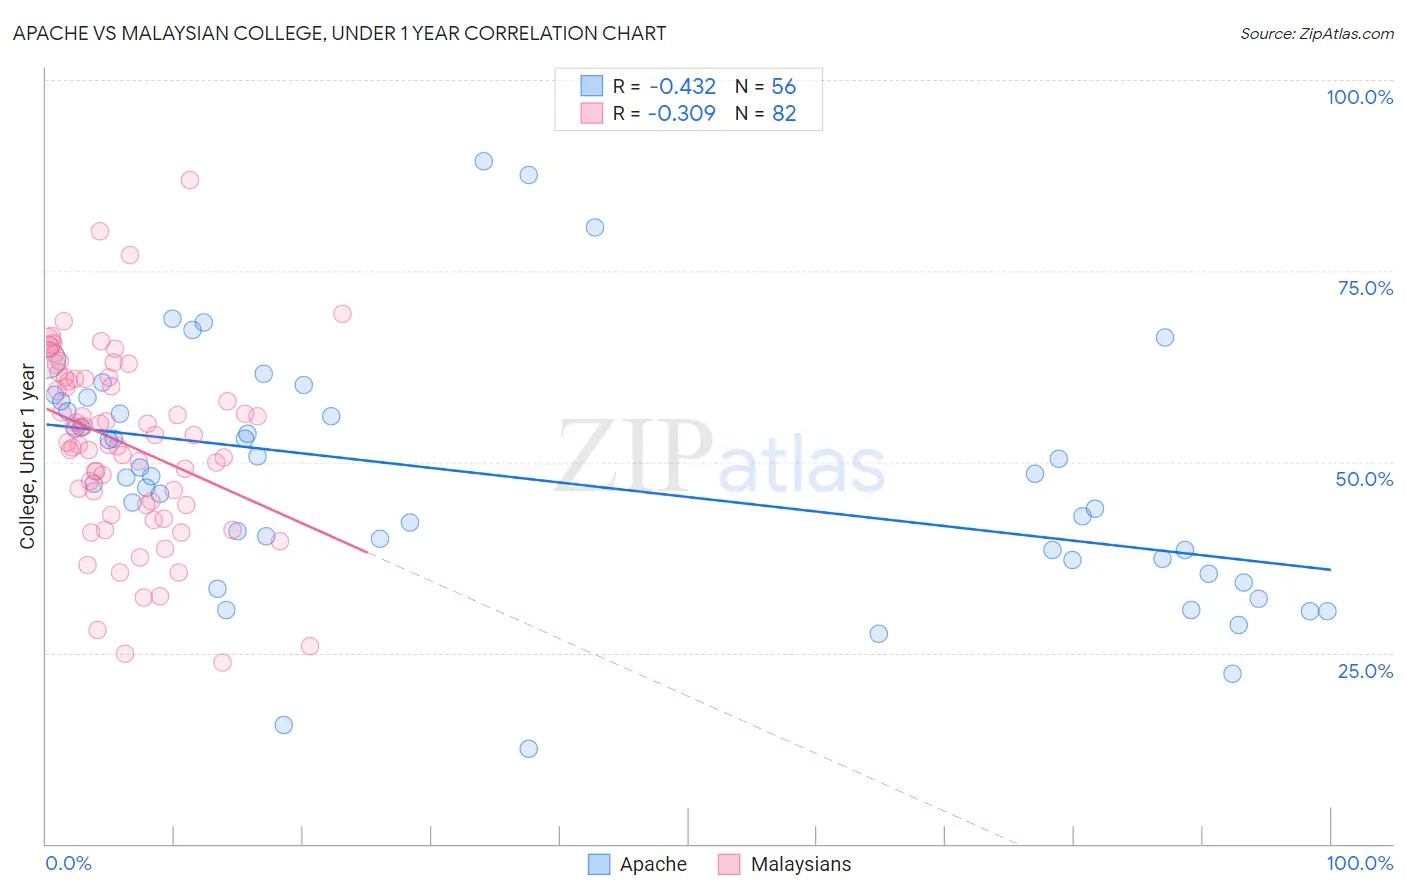
Apache vs Malaysian College, Under 1 year Correlation Chart
The statistical analysis conducted on geographies consisting of 231,142,948 people shows a moderate negative correlation between the proportion of Apache and percentage of population with at least college, under 1 year education in the United States with a correlation coefficient (R) of -0.432 and weighted average of 58.0%. Similarly, the statistical analysis conducted on geographies consisting of 226,109,118 people shows a mild negative correlation between the proportion of Malaysians and percentage of population with at least college, under 1 year education in the United States with a correlation coefficient (R) of -0.309 and weighted average of 62.2%, a difference of 7.1%.
College, Under 1 year Correlation Summary
| Measurement | Apache | Malaysian |
| Minimum | 12.5% | 23.8% |
| Maximum | 89.3% | 86.9% |
| Range | 76.8% | 63.2% |
| Mean | 47.9% | 52.4% |
| Median | 48.0% | 53.0% |
| Interquartile 25% (IQ1) | 37.3% | 44.4% |
| Interquartile 75% (IQ3) | 57.3% | 60.9% |
| Interquartile Range (IQR) | 20.1% | 16.6% |
| Standard Deviation (Sample) | 15.9% | 12.1% |
| Standard Deviation (Population) | 15.7% | 12.1% |
Similar Demographics by College, Under 1 year
Demographics Similar to Apache by College, Under 1 year
In terms of college, under 1 year, the demographic groups most similar to Apache are Mexican American Indian (58.1%, a difference of 0.19%), Immigrants from Dominica (57.9%, a difference of 0.29%), Kiowa (57.8%, a difference of 0.30%), Haitian (57.8%, a difference of 0.42%), and Immigrants from Portugal (57.7%, a difference of 0.62%).
| Demographics | Rating | Rank | College, Under 1 year |
| Immigrants | Grenada | 0.0 /100 | #295 | Tragic 59.1% |
| Central American Indians | 0.0 /100 | #296 | Tragic 59.0% |
| Guyanese | 0.0 /100 | #297 | Tragic 59.0% |
| Immigrants | Ecuador | 0.0 /100 | #298 | Tragic 58.7% |
| Cubans | 0.0 /100 | #299 | Tragic 58.6% |
| Immigrants | Guyana | 0.0 /100 | #300 | Tragic 58.5% |
| Mexican American Indians | 0.0 /100 | #301 | Tragic 58.1% |
| Apache | 0.0 /100 | #302 | Tragic 58.0% |
| Immigrants | Dominica | 0.0 /100 | #303 | Tragic 57.9% |
| Kiowa | 0.0 /100 | #304 | Tragic 57.8% |
| Haitians | 0.0 /100 | #305 | Tragic 57.8% |
| Immigrants | Portugal | 0.0 /100 | #306 | Tragic 57.7% |
| Fijians | 0.0 /100 | #307 | Tragic 57.7% |
| Central Americans | 0.0 /100 | #308 | Tragic 57.7% |
| Immigrants | Nicaragua | 0.0 /100 | #309 | Tragic 57.6% |
Demographics Similar to Malaysians by College, Under 1 year
In terms of college, under 1 year, the demographic groups most similar to Malaysians are Hawaiian (62.1%, a difference of 0.030%), Ottawa (62.2%, a difference of 0.050%), Nepalese (62.2%, a difference of 0.060%), Aleut (62.2%, a difference of 0.060%), and Colville (62.1%, a difference of 0.12%).
| Demographics | Rating | Rank | College, Under 1 year |
| Spanish Americans | 1.9 /100 | #235 | Tragic 62.6% |
| Immigrants | Immigrants | 1.7 /100 | #236 | Tragic 62.5% |
| Immigrants | Burma/Myanmar | 1.6 /100 | #237 | Tragic 62.5% |
| French American Indians | 1.5 /100 | #238 | Tragic 62.4% |
| Nepalese | 1.1 /100 | #239 | Tragic 62.2% |
| Aleuts | 1.1 /100 | #240 | Tragic 62.2% |
| Ottawa | 1.1 /100 | #241 | Tragic 62.2% |
| Malaysians | 1.1 /100 | #242 | Tragic 62.2% |
| Hawaiians | 1.1 /100 | #243 | Tragic 62.1% |
| Colville | 1.0 /100 | #244 | Tragic 62.1% |
| Delaware | 0.9 /100 | #245 | Tragic 62.1% |
| Marshallese | 0.8 /100 | #246 | Tragic 61.9% |
| Immigrants | Liberia | 0.8 /100 | #247 | Tragic 61.9% |
| Potawatomi | 0.6 /100 | #248 | Tragic 61.8% |
| Vietnamese | 0.5 /100 | #249 | Tragic 61.7% |