Immigrants from Europe vs Jamaican College, Under 1 year
COMPARE
Immigrants from Europe
Jamaican
College, Under 1 year
College, Under 1 year Comparison
Immigrants from Europe
Jamaicans
68.8%
COLLEGE, UNDER 1 YEAR
99.1/ 100
METRIC RATING
71st/ 347
METRIC RANK
60.5%
COLLEGE, UNDER 1 YEAR
0.1/ 100
METRIC RATING
272nd/ 347
METRIC RANK
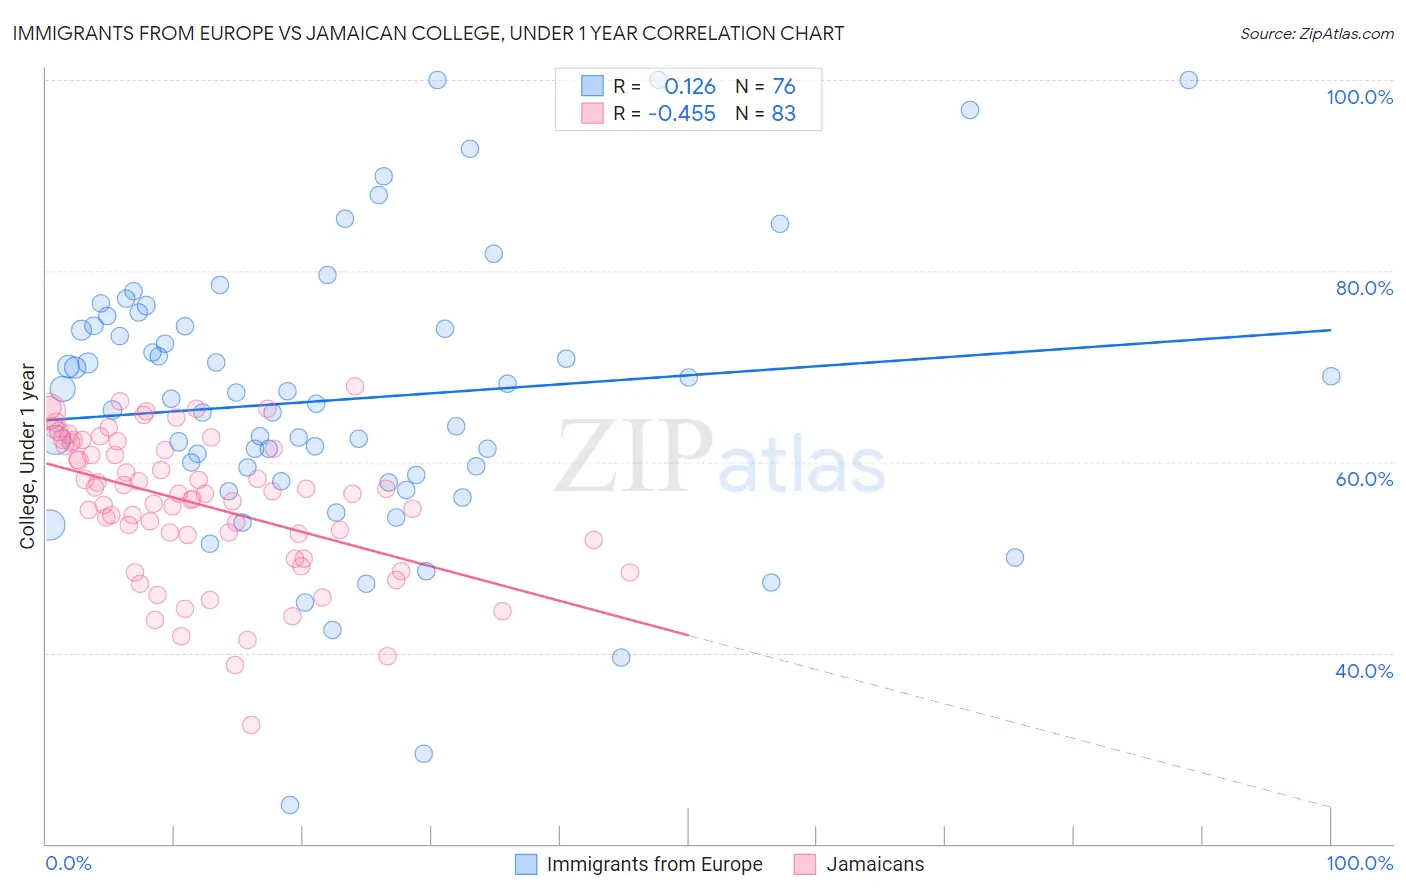
Immigrants from Europe vs Jamaican College, Under 1 year Correlation Chart
The statistical analysis conducted on geographies consisting of 547,420,628 people shows a poor positive correlation between the proportion of Immigrants from Europe and percentage of population with at least college, under 1 year education in the United States with a correlation coefficient (R) of 0.126 and weighted average of 68.8%. Similarly, the statistical analysis conducted on geographies consisting of 368,078,751 people shows a moderate negative correlation between the proportion of Jamaicans and percentage of population with at least college, under 1 year education in the United States with a correlation coefficient (R) of -0.455 and weighted average of 60.5%, a difference of 13.7%.
College, Under 1 year Correlation Summary
| Measurement | Immigrants from Europe | Jamaican |
| Minimum | 24.0% | 32.5% |
| Maximum | 100.0% | 68.0% |
| Range | 76.0% | 35.5% |
| Mean | 66.5% | 55.6% |
| Median | 66.3% | 56.7% |
| Interquartile 25% (IQ1) | 58.3% | 51.9% |
| Interquartile 75% (IQ3) | 74.2% | 62.0% |
| Interquartile Range (IQR) | 16.0% | 10.1% |
| Standard Deviation (Sample) | 14.7% | 7.5% |
| Standard Deviation (Population) | 14.6% | 7.4% |
Similar Demographics by College, Under 1 year
Demographics Similar to Immigrants from Europe by College, Under 1 year
In terms of college, under 1 year, the demographic groups most similar to Immigrants from Europe are Lithuanian (68.8%, a difference of 0.010%), Bolivian (68.7%, a difference of 0.040%), Immigrants from England (68.7%, a difference of 0.080%), Swedish (68.7%, a difference of 0.14%), and Immigrants from Romania (68.9%, a difference of 0.18%).
| Demographics | Rating | Rank | College, Under 1 year |
| Northern Europeans | 99.4 /100 | #64 | Exceptional 69.0% |
| Immigrants | Moldova | 99.3 /100 | #65 | Exceptional 69.0% |
| Immigrants | North America | 99.3 /100 | #66 | Exceptional 69.0% |
| Immigrants | Zimbabwe | 99.2 /100 | #67 | Exceptional 68.9% |
| Immigrants | Indonesia | 99.2 /100 | #68 | Exceptional 68.9% |
| Immigrants | Romania | 99.2 /100 | #69 | Exceptional 68.9% |
| Lithuanians | 99.1 /100 | #70 | Exceptional 68.8% |
| Immigrants | Europe | 99.1 /100 | #71 | Exceptional 68.8% |
| Bolivians | 99.0 /100 | #72 | Exceptional 68.7% |
| Immigrants | England | 99.0 /100 | #73 | Exceptional 68.7% |
| Swedes | 98.9 /100 | #74 | Exceptional 68.7% |
| Immigrants | Western Europe | 98.6 /100 | #75 | Exceptional 68.5% |
| Laotians | 98.6 /100 | #76 | Exceptional 68.5% |
| British | 98.6 /100 | #77 | Exceptional 68.5% |
| Danes | 98.6 /100 | #78 | Exceptional 68.5% |
Demographics Similar to Jamaicans by College, Under 1 year
In terms of college, under 1 year, the demographic groups most similar to Jamaicans are Chickasaw (60.4%, a difference of 0.050%), Alaska Native (60.4%, a difference of 0.050%), U.S. Virgin Islander (60.6%, a difference of 0.16%), Cheyenne (60.6%, a difference of 0.17%), and Immigrants from Barbados (60.4%, a difference of 0.18%).
| Demographics | Rating | Rank | College, Under 1 year |
| Immigrants | Bahamas | 0.2 /100 | #265 | Tragic 61.1% |
| Alaskan Athabascans | 0.2 /100 | #266 | Tragic 61.0% |
| Americans | 0.2 /100 | #267 | Tragic 61.0% |
| Immigrants | Trinidad and Tobago | 0.1 /100 | #268 | Tragic 60.7% |
| Immigrants | West Indies | 0.1 /100 | #269 | Tragic 60.6% |
| Cheyenne | 0.1 /100 | #270 | Tragic 60.6% |
| U.S. Virgin Islanders | 0.1 /100 | #271 | Tragic 60.6% |
| Jamaicans | 0.1 /100 | #272 | Tragic 60.5% |
| Chickasaw | 0.1 /100 | #273 | Tragic 60.4% |
| Alaska Natives | 0.1 /100 | #274 | Tragic 60.4% |
| Immigrants | Barbados | 0.1 /100 | #275 | Tragic 60.4% |
| Arapaho | 0.1 /100 | #276 | Tragic 60.3% |
| Bahamians | 0.1 /100 | #277 | Tragic 60.3% |
| Yaqui | 0.1 /100 | #278 | Tragic 60.2% |
| Ute | 0.1 /100 | #279 | Tragic 60.2% |