Polish vs Jamaican College, Under 1 year
COMPARE
Polish
Jamaican
College, Under 1 year
College, Under 1 year Comparison
Poles
Jamaicans
66.9%
COLLEGE, UNDER 1 YEAR
88.4/ 100
METRIC RATING
132nd/ 347
METRIC RANK
60.5%
COLLEGE, UNDER 1 YEAR
0.1/ 100
METRIC RATING
272nd/ 347
METRIC RANK
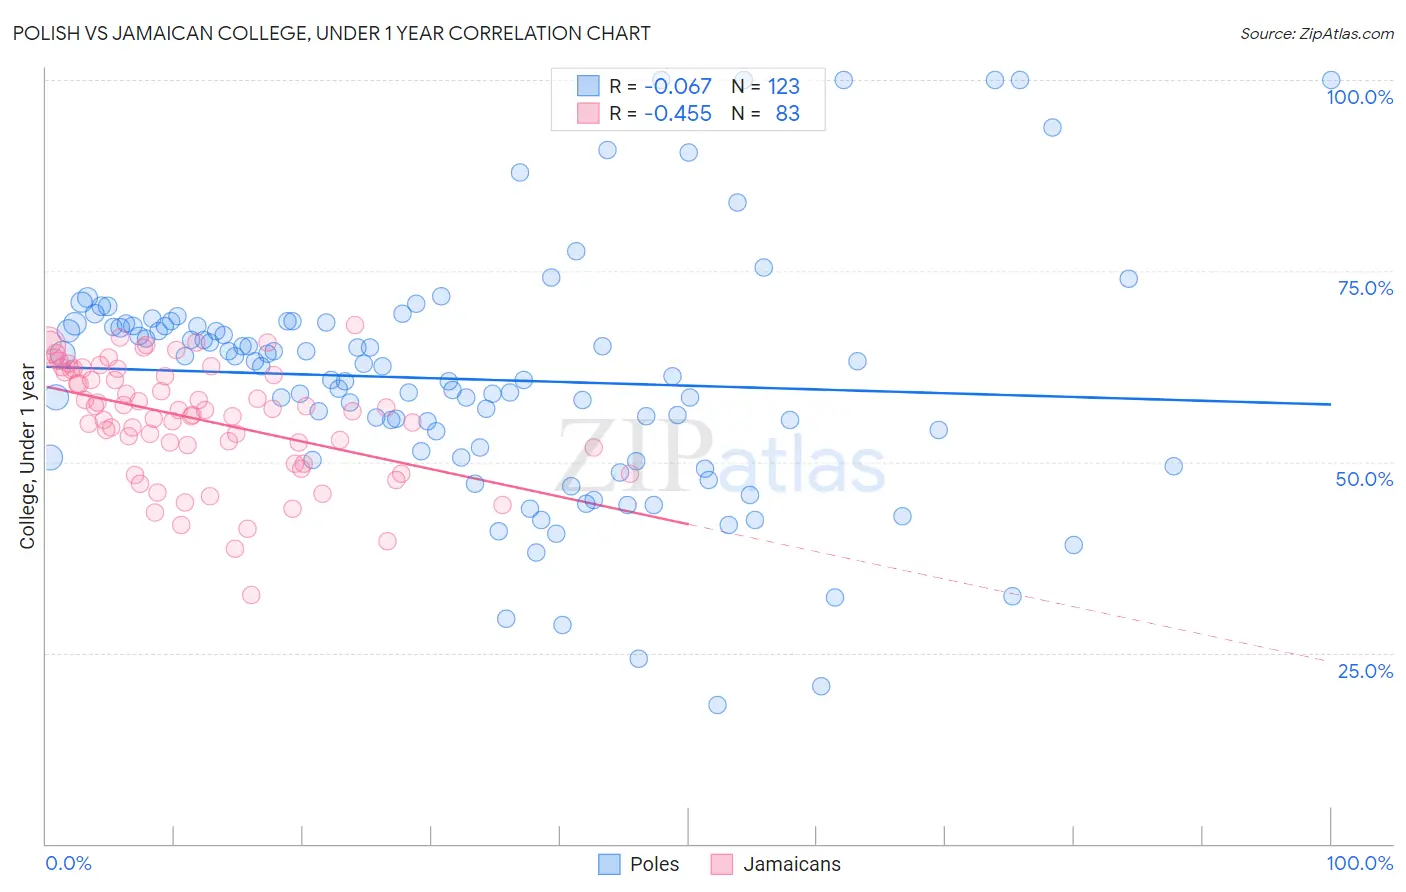
Polish vs Jamaican College, Under 1 year Correlation Chart
The statistical analysis conducted on geographies consisting of 560,588,351 people shows a slight negative correlation between the proportion of Poles and percentage of population with at least college, under 1 year education in the United States with a correlation coefficient (R) of -0.067 and weighted average of 66.9%. Similarly, the statistical analysis conducted on geographies consisting of 368,078,751 people shows a moderate negative correlation between the proportion of Jamaicans and percentage of population with at least college, under 1 year education in the United States with a correlation coefficient (R) of -0.455 and weighted average of 60.5%, a difference of 10.6%.
College, Under 1 year Correlation Summary
| Measurement | Polish | Jamaican |
| Minimum | 18.2% | 32.5% |
| Maximum | 100.0% | 68.0% |
| Range | 81.8% | 35.5% |
| Mean | 60.8% | 55.6% |
| Median | 62.5% | 56.7% |
| Interquartile 25% (IQ1) | 50.6% | 51.9% |
| Interquartile 75% (IQ3) | 68.1% | 62.0% |
| Interquartile Range (IQR) | 17.4% | 10.1% |
| Standard Deviation (Sample) | 16.0% | 7.5% |
| Standard Deviation (Population) | 15.9% | 7.4% |
Similar Demographics by College, Under 1 year
Demographics Similar to Poles by College, Under 1 year
In terms of college, under 1 year, the demographic groups most similar to Poles are Immigrants from Brazil (66.9%, a difference of 0.010%), Finnish (66.9%, a difference of 0.020%), Iraqi (66.8%, a difference of 0.050%), Immigrants from Syria (66.9%, a difference of 0.060%), and Canadian (66.8%, a difference of 0.060%).
| Demographics | Rating | Rank | College, Under 1 year |
| Italians | 91.8 /100 | #125 | Exceptional 67.2% |
| Alsatians | 91.3 /100 | #126 | Exceptional 67.1% |
| Czechs | 90.8 /100 | #127 | Exceptional 67.1% |
| Scottish | 90.2 /100 | #128 | Exceptional 67.0% |
| Immigrants | Eastern Africa | 89.5 /100 | #129 | Excellent 67.0% |
| Immigrants | Syria | 89.0 /100 | #130 | Excellent 66.9% |
| Finns | 88.6 /100 | #131 | Excellent 66.9% |
| Poles | 88.4 /100 | #132 | Excellent 66.9% |
| Immigrants | Brazil | 88.3 /100 | #133 | Excellent 66.9% |
| Iraqis | 88.0 /100 | #134 | Excellent 66.8% |
| Canadians | 87.9 /100 | #135 | Excellent 66.8% |
| Ugandans | 87.8 /100 | #136 | Excellent 66.8% |
| Immigrants | Chile | 87.4 /100 | #137 | Excellent 66.8% |
| Immigrants | Italy | 86.9 /100 | #138 | Excellent 66.8% |
| Venezuelans | 85.9 /100 | #139 | Excellent 66.7% |
Demographics Similar to Jamaicans by College, Under 1 year
In terms of college, under 1 year, the demographic groups most similar to Jamaicans are Chickasaw (60.4%, a difference of 0.050%), Alaska Native (60.4%, a difference of 0.050%), U.S. Virgin Islander (60.6%, a difference of 0.16%), Cheyenne (60.6%, a difference of 0.17%), and Immigrants from Barbados (60.4%, a difference of 0.18%).
| Demographics | Rating | Rank | College, Under 1 year |
| Immigrants | Bahamas | 0.2 /100 | #265 | Tragic 61.1% |
| Alaskan Athabascans | 0.2 /100 | #266 | Tragic 61.0% |
| Americans | 0.2 /100 | #267 | Tragic 61.0% |
| Immigrants | Trinidad and Tobago | 0.1 /100 | #268 | Tragic 60.7% |
| Immigrants | West Indies | 0.1 /100 | #269 | Tragic 60.6% |
| Cheyenne | 0.1 /100 | #270 | Tragic 60.6% |
| U.S. Virgin Islanders | 0.1 /100 | #271 | Tragic 60.6% |
| Jamaicans | 0.1 /100 | #272 | Tragic 60.5% |
| Chickasaw | 0.1 /100 | #273 | Tragic 60.4% |
| Alaska Natives | 0.1 /100 | #274 | Tragic 60.4% |
| Immigrants | Barbados | 0.1 /100 | #275 | Tragic 60.4% |
| Arapaho | 0.1 /100 | #276 | Tragic 60.3% |
| Bahamians | 0.1 /100 | #277 | Tragic 60.3% |
| Yaqui | 0.1 /100 | #278 | Tragic 60.2% |
| Ute | 0.1 /100 | #279 | Tragic 60.2% |