Apache vs Pennsylvania German College, Under 1 year

COMPARE

Apache
Race
Ancestry
AfghanAfricanAlaska NativeAlaskan AthabascanAlbanianAleutAlsatianAmericanApacheArabArapahoArgentineanArmenianAssyrian/Chaldean/SyriacAustralianAustrianBahamianBangladeshiBarbadianBasqueBelgianBelizeanBermudanBhutaneseBlackfeetBolivianBrazilianBritishBritish West IndianBulgarianBurmeseCajunCambodianCanadianCape VerdeanCarpatho RusynCelticCentral AmericanCentral American IndianCherokeeCheyenneChickasawChileanChineseChippewaChoctawColombianColvilleComancheCosta RicanCreeCreekCroatianCrowCubanCypriotCzechCzechoslovakianDanishDelawareDominicanDutchDutch West IndianEastern EuropeanEcuadorianEgyptianEnglishEstonianEthiopianEuropeanFijianFilipinoFinnishFrenchFrench American IndianFrench CanadianGermanGerman RussianGhanaianGreekGuamanian/ChamorroGuatemalanGuyaneseHaitianHmongHonduranHopiHoumaHungarianIcelanderIndian (Asian)IndonesianInupiatIranianIraqiIrishIroquoisIsraeliItalianJamaicanJapaneseJordanianKenyanKiowaKoreanLaotianLatvianLebaneseLiberianLithuanianLumbeeLuxembourgerMacedonianMalaysianMalteseMarshalleseMenomineeMexicanMexican American IndianMongolianMoroccanNative HawaiianNavajoNepaleseNew ZealanderNicaraguanNigerianNorthern EuropeanNorwegianOkinawanOsageOttawaPaiutePakistaniPalestinianPanamanianParaguayanPeruvianPimaPolishPortuguesePotawatomiPuebloPuerto RicanPuget Sound SalishRomanianRussianSalvadoranSamoanScandinavianScotch-IrishScottishSeminoleSenegaleseSerbianShoshoneSierra LeoneanSiouxSlavicSlovakSloveneSomaliSouth AfricanSouth AmericanSouth American IndianSoviet UnionSpaniardSpanishSpanish AmericanSpanish American IndianSri LankanSubsaharan AfricanSudaneseSwedishSwissSyrianTaiwaneseThaiTlingit-HaidaTohono O'OdhamTonganTrinidadian and TobagonianTsimshianTurkishU.S. Virgin IslanderUgandanUkrainianUruguayanUteVenezuelanVietnameseWelshWest IndianYakamaYaquiYugoslavianYumanYup'ikZimbabwean
Immigration
NonimmigrantsImmigrantsAfghanistanAfricaAlbaniaArgentinaArmeniaAsiaAustraliaAustriaBahamasBangladeshBarbadosBelarusBelgiumBelizeBoliviaBosnia and HerzegovinaBrazilBulgariaBurma/MyanmarCabo VerdeCambodiaCameroonCanadaCaribbeanCentral AmericaChileChinaColombiaCongoCosta RicaCroatiaCubaCzechoslovakiaDenmarkDominicaDominican RepublicEastern AfricaEastern AsiaEastern EuropeEcuadorEgyptEl SalvadorEnglandEritreaEthiopiaEuropeFijiFranceGermanyGhanaGreeceGrenadaGuatemalaGuyanaHaitiHondurasHong KongHungaryIndiaIndonesiaIranIraqIrelandIsraelItalyJamaicaJapanJordanKazakhstanKenyaKoreaKuwaitLaosLatin AmericaLatviaLebanonLiberiaLithuaniaMalaysiaMexicoMicronesiaMiddle AfricaMoldovaMoroccoNepalNetherlandsNicaraguaNigeriaNorth AmericaNorth MacedoniaNorthern AfricaNorthern EuropeNorwayOceaniaPakistanPanamaPeruPhilippinesPolandPortugalRomaniaRussiaSaudi ArabiaScotlandSenegalSerbiaSierra LeoneSingaporeSomaliaSouth AfricaSouth AmericaSouth Central AsiaSouth Eastern AsiaSouthern EuropeSpainSri LankaSt. Vincent and the GrenadinesSudanSwedenSwitzerlandSyriaTaiwanThailandTrinidad and TobagoTurkeyUgandaUkraineUruguayUzbekistanVenezuelaVietnamWest IndiesWestern AfricaWestern AsiaWestern EuropeYemenZaireZimbabweAzores
Pennsylvania German
Race
Ancestry
AfghanAfricanAlaska NativeAlaskan AthabascanAlbanianAleutAlsatianAmericanArabArapahoArgentineanArmenianAssyrian/Chaldean/SyriacAustralianAustrianBahamianBangladeshiBarbadianBasqueBelgianBelizeanBermudanBhutaneseBlackfeetBolivianBrazilianBritishBritish West IndianBulgarianBurmeseCajunCambodianCanadianCape VerdeanCarpatho RusynCelticCentral AmericanCentral American IndianCherokeeCheyenneChickasawChileanChineseChippewaChoctawColombianColvilleComancheCosta RicanCreeCreekCroatianCrowCubanCypriotCzechCzechoslovakianDanishDelawareDominicanDutchDutch West IndianEastern EuropeanEcuadorianEgyptianEnglishEstonianEthiopianEuropeanFijianFilipinoFinnishFrenchFrench American IndianFrench CanadianGermanGerman RussianGhanaianGreekGuamanian/ChamorroGuatemalanGuyaneseHaitianHmongHonduranHopiHoumaHungarianIcelanderIndian (Asian)IndonesianInupiatIranianIraqiIrishIroquoisIsraeliItalianJamaicanJapaneseJordanianKenyanKiowaKoreanLaotianLatvianLebaneseLiberianLithuanianLumbeeLuxembourgerMacedonianMalaysianMalteseMarshalleseMenomineeMexicanMexican American IndianMongolianMoroccanNative HawaiianNavajoNepaleseNew ZealanderNicaraguanNigerianNorthern EuropeanNorwegianOkinawanOsageOttawaPaiutePakistaniPalestinianPanamanianParaguayanPennsylvania GermanPeruvianPimaPolishPortuguesePotawatomiPuebloPuerto RicanPuget Sound SalishRomanianRussianSalvadoranSamoanScandinavianScotch-IrishScottishSeminoleSenegaleseSerbianShoshoneSierra LeoneanSiouxSlavicSlovakSloveneSomaliSouth AfricanSouth AmericanSouth American IndianSoviet UnionSpaniardSpanishSpanish AmericanSpanish American IndianSri LankanSubsaharan AfricanSudaneseSwedishSwissSyrianTaiwaneseThaiTlingit-HaidaTohono O'OdhamTonganTrinidadian and TobagonianTsimshianTurkishU.S. Virgin IslanderUgandanUkrainianUruguayanUteVenezuelanVietnameseWelshWest IndianYakamaYaquiYugoslavianYumanYup'ikZimbabwean
Immigration
NonimmigrantsImmigrantsAfghanistanAfricaAlbaniaArgentinaArmeniaAsiaAustraliaAustriaBahamasBangladeshBarbadosBelarusBelgiumBelizeBoliviaBosnia and HerzegovinaBrazilBulgariaBurma/MyanmarCabo VerdeCambodiaCameroonCanadaCaribbeanCentral AmericaChileChinaColombiaCongoCosta RicaCroatiaCubaCzechoslovakiaDenmarkDominicaDominican RepublicEastern AfricaEastern AsiaEastern EuropeEcuadorEgyptEl SalvadorEnglandEritreaEthiopiaEuropeFijiFranceGermanyGhanaGreeceGrenadaGuatemalaGuyanaHaitiHondurasHong KongHungaryIndiaIndonesiaIranIraqIrelandIsraelItalyJamaicaJapanJordanKazakhstanKenyaKoreaKuwaitLaosLatin AmericaLatviaLebanonLiberiaLithuaniaMalaysiaMexicoMicronesiaMiddle AfricaMoldovaMoroccoNepalNetherlandsNicaraguaNigeriaNorth AmericaNorth MacedoniaNorthern AfricaNorthern EuropeNorwayOceaniaPakistanPanamaPeruPhilippinesPolandPortugalRomaniaRussiaSaudi ArabiaScotlandSenegalSerbiaSierra LeoneSingaporeSomaliaSouth AfricaSouth AmericaSouth Central AsiaSouth Eastern AsiaSouthern EuropeSpainSri LankaSt. Vincent and the GrenadinesSudanSwedenSwitzerlandSyriaTaiwanThailandTrinidad and TobagoTurkeyUgandaUkraineUruguayUzbekistanVenezuelaVietnamWest IndiesWestern AfricaWestern AsiaWestern EuropeYemenZaireZimbabweAzores
College, Under 1 year
Income
Poverty
Unemployment
Labor Participation
Family Structure
Vehicle Availability
Education Level
Disability

College, Under 1 year Comparison

Apache

Pennsylvania Germans

Tragic
Tragic
58.0%
COLLEGE, UNDER 1 YEAR
0.0/ 100
METRIC RATING
302nd/ 347
METRIC RANK
54.5%
COLLEGE, UNDER 1 YEAR
0.0/ 100
METRIC RATING
336th/ 347
METRIC RANK

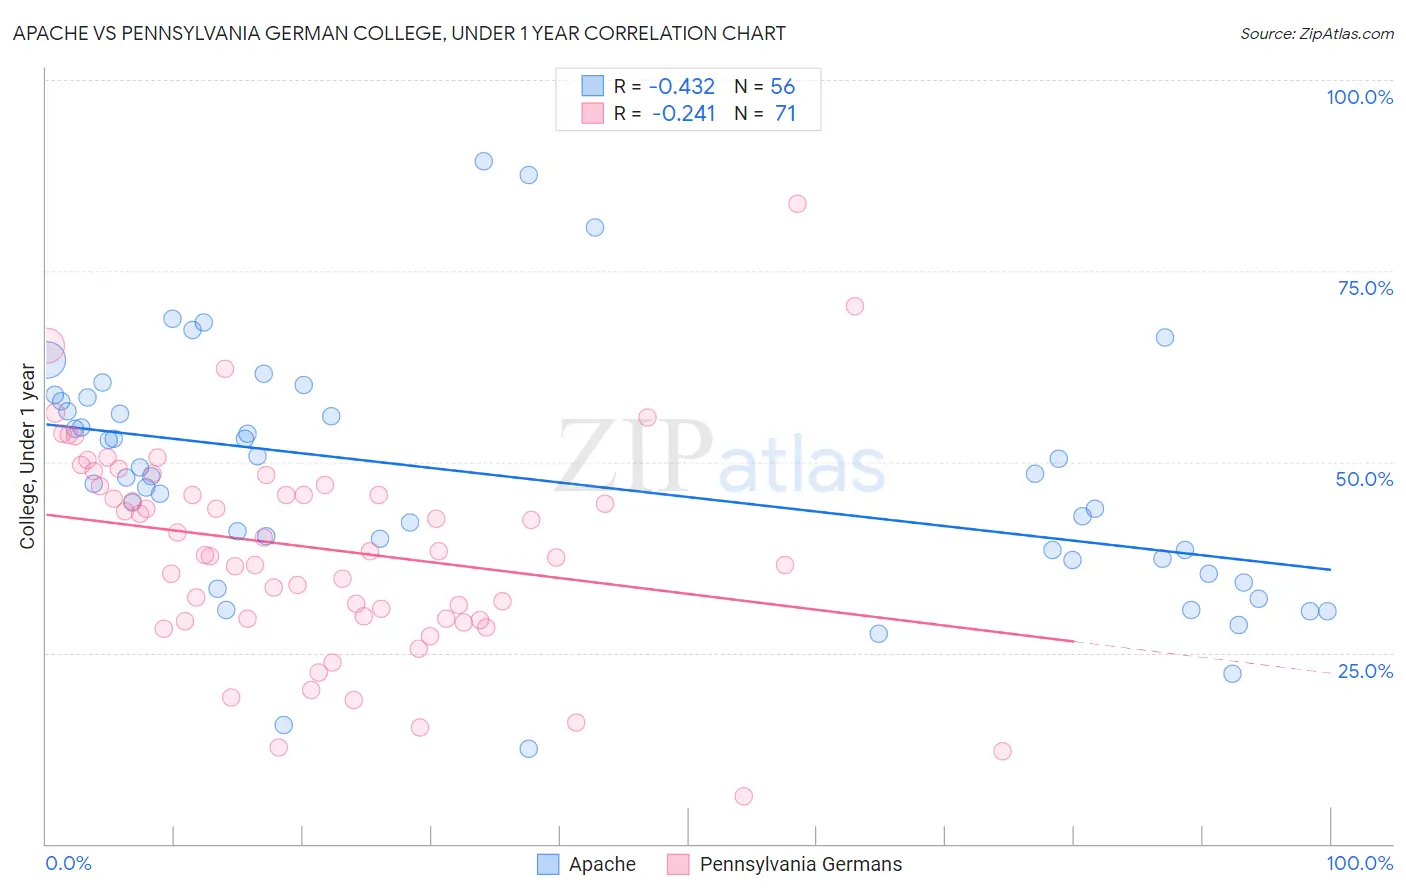
Apache vs Pennsylvania German College, Under 1 year Correlation Chart

The statistical analysis conducted on geographies consisting of 231,142,948 people shows a moderate negative correlation between the proportion of Apache and percentage of population with at least college, under 1 year education in the United States with a correlation coefficient (R) of -0.432 and weighted average of 58.0%. Similarly, the statistical analysis conducted on geographies consisting of 234,102,446 people shows a weak negative correlation between the proportion of Pennsylvania Germans and percentage of population with at least college, under 1 year education in the United States with a correlation coefficient (R) of -0.241 and weighted average of 54.5%, a difference of 6.4%.
Apache vs Pennsylvania German College, Under 1 year

College, Under 1 year Correlation Summary

MeasurementApachePennsylvania German
Minimum12.5%6.2%
Maximum89.3%83.9%
Range76.8%77.6%
Mean47.9%38.7%
Median48.0%38.2%
Interquartile 25% (IQ1)37.3%29.4%
Interquartile 75% (IQ3)57.3%46.9%
Interquartile Range (IQR)20.1%17.5%
Standard Deviation (Sample)15.9%13.9%
Standard Deviation (Population)15.7%13.8%

Similar Demographics by College, Under 1 year

Demographics Similar to Apache by College, Under 1 year

In terms of college, under 1 year, the demographic groups most similar to Apache are Mexican American Indian (58.1%, a difference of 0.19%), Immigrants from Dominica (57.9%, a difference of 0.29%), Kiowa (57.8%, a difference of 0.30%), Haitian (57.8%, a difference of 0.42%), and Immigrants from Portugal (57.7%, a difference of 0.62%).
DemographicsRating | RankCollege, Under 1 year
Immigrants | Grenada
0.0
/100
|
#295
Tragic
59.1%
Central American Indians
0.0
/100
|
#296
Tragic
59.0%
Guyanese
0.0
/100
|
#297
Tragic
59.0%
Immigrants | Ecuador
0.0
/100
|
#298
Tragic
58.7%
Cubans
0.0
/100
|
#299
Tragic
58.6%
Immigrants | Guyana
0.0
/100
|
#300
Tragic
58.5%
Mexican American Indians
0.0
/100
|
#301
Tragic
58.1%
Apache
0.0
/100
|
#302
Tragic
58.0%
Immigrants | Dominica
0.0
/100
|
#303
Tragic
57.9%
Kiowa
0.0
/100
|
#304
Tragic
57.8%
Haitians
0.0
/100
|
#305
Tragic
57.8%
Immigrants | Portugal
0.0
/100
|
#306
Tragic
57.7%
Fijians
0.0
/100
|
#307
Tragic
57.7%
Central Americans
0.0
/100
|
#308
Tragic
57.7%
Immigrants | Nicaragua
0.0
/100
|
#309
Tragic
57.6%

Demographics Similar to Pennsylvania Germans by College, Under 1 year

In terms of college, under 1 year, the demographic groups most similar to Pennsylvania Germans are Immigrants from Central America (54.4%, a difference of 0.15%), Inupiat (54.6%, a difference of 0.17%), Immigrants from the Azores (54.7%, a difference of 0.30%), Lumbee (54.2%, a difference of 0.56%), and Immigrants from Dominican Republic (54.0%, a difference of 0.96%).
DemographicsRating | RankCollege, Under 1 year
Immigrants | Cuba
0.0
/100
|
#329
Tragic
55.7%
Mexicans
0.0
/100
|
#330
Tragic
55.6%
Dominicans
0.0
/100
|
#331
Tragic
55.5%
Immigrants | Yemen
0.0
/100
|
#332
Tragic
55.3%
Yuman
0.0
/100
|
#333
Tragic
55.1%
Immigrants | Azores
0.0
/100
|
#334
Tragic
54.7%
Inupiat
0.0
/100
|
#335
Tragic
54.6%
Pennsylvania Germans
0.0
/100
|
#336
Tragic
54.5%
Immigrants | Central America
0.0
/100
|
#337
Tragic
54.4%
Lumbee
0.0
/100
|
#338
Tragic
54.2%
Immigrants | Dominican Republic
0.0
/100
|
#339
Tragic
54.0%
Spanish American Indians
0.0
/100
|
#340
Tragic
54.0%
Immigrants | Cabo Verde
0.0
/100
|
#341
Tragic
53.7%
Immigrants | Mexico
0.0
/100
|
#342
Tragic
53.7%
Tohono O'odham
0.0
/100
|
#343
Tragic
52.8%