Apache vs Pueblo College, Under 1 year
COMPARE
Apache
Pueblo
College, Under 1 year
College, Under 1 year Comparison
Apache
Pueblo
58.0%
COLLEGE, UNDER 1 YEAR
0.0/ 100
METRIC RATING
302nd/ 347
METRIC RANK
57.4%
COLLEGE, UNDER 1 YEAR
0.0/ 100
METRIC RATING
310th/ 347
METRIC RANK
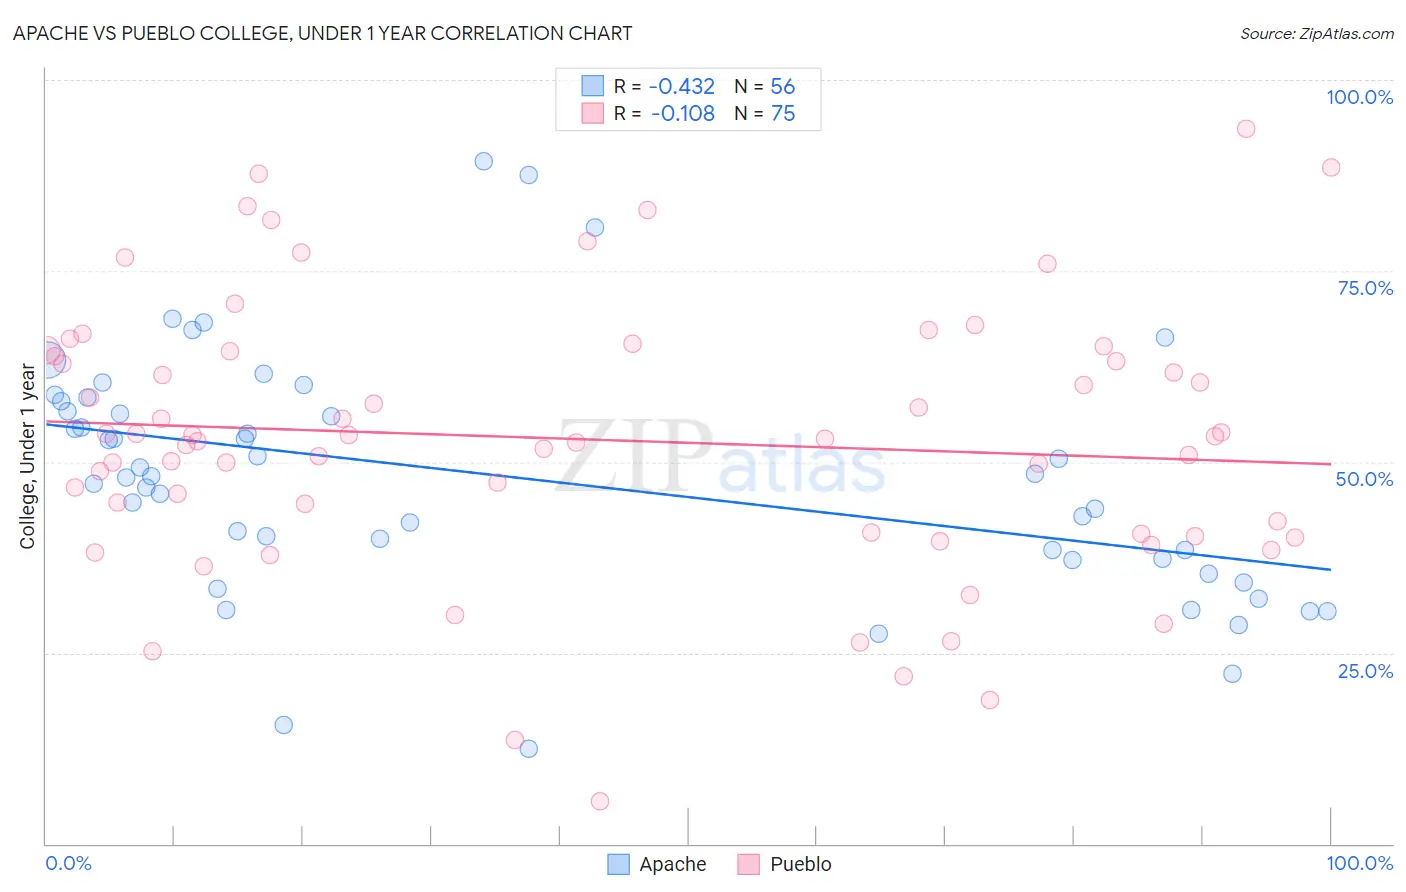
Apache vs Pueblo College, Under 1 year Correlation Chart
The statistical analysis conducted on geographies consisting of 231,142,948 people shows a moderate negative correlation between the proportion of Apache and percentage of population with at least college, under 1 year education in the United States with a correlation coefficient (R) of -0.432 and weighted average of 58.0%. Similarly, the statistical analysis conducted on geographies consisting of 120,087,269 people shows a poor negative correlation between the proportion of Pueblo and percentage of population with at least college, under 1 year education in the United States with a correlation coefficient (R) of -0.108 and weighted average of 57.4%, a difference of 1.1%.
College, Under 1 year Correlation Summary
| Measurement | Apache | Pueblo |
| Minimum | 12.5% | 5.6% |
| Maximum | 89.3% | 93.5% |
| Range | 76.8% | 88.0% |
| Mean | 47.9% | 52.9% |
| Median | 48.0% | 53.0% |
| Interquartile 25% (IQ1) | 37.3% | 40.5% |
| Interquartile 75% (IQ3) | 57.3% | 64.5% |
| Interquartile Range (IQR) | 20.1% | 23.9% |
| Standard Deviation (Sample) | 15.9% | 17.8% |
| Standard Deviation (Population) | 15.7% | 17.7% |
Demographics Similar to Apache and Pueblo by College, Under 1 year
In terms of college, under 1 year, the demographic groups most similar to Apache are Mexican American Indian (58.1%, a difference of 0.19%), Immigrants from Dominica (57.9%, a difference of 0.29%), Kiowa (57.8%, a difference of 0.30%), Haitian (57.8%, a difference of 0.42%), and Immigrants from Portugal (57.7%, a difference of 0.62%). Similarly, the demographic groups most similar to Pueblo are Cajun (57.3%, a difference of 0.060%), Salvadoran (57.3%, a difference of 0.12%), Dutch West Indian (57.2%, a difference of 0.36%), Immigrants from Nicaragua (57.6%, a difference of 0.39%), and Hopi (57.1%, a difference of 0.48%).
| Demographics | Rating | Rank | College, Under 1 year |
| Central American Indians | 0.0 /100 | #296 | Tragic 59.0% |
| Guyanese | 0.0 /100 | #297 | Tragic 59.0% |
| Immigrants | Ecuador | 0.0 /100 | #298 | Tragic 58.7% |
| Cubans | 0.0 /100 | #299 | Tragic 58.6% |
| Immigrants | Guyana | 0.0 /100 | #300 | Tragic 58.5% |
| Mexican American Indians | 0.0 /100 | #301 | Tragic 58.1% |
| Apache | 0.0 /100 | #302 | Tragic 58.0% |
| Immigrants | Dominica | 0.0 /100 | #303 | Tragic 57.9% |
| Kiowa | 0.0 /100 | #304 | Tragic 57.8% |
| Haitians | 0.0 /100 | #305 | Tragic 57.8% |
| Immigrants | Portugal | 0.0 /100 | #306 | Tragic 57.7% |
| Fijians | 0.0 /100 | #307 | Tragic 57.7% |
| Central Americans | 0.0 /100 | #308 | Tragic 57.7% |
| Immigrants | Nicaragua | 0.0 /100 | #309 | Tragic 57.6% |
| Pueblo | 0.0 /100 | #310 | Tragic 57.4% |
| Cajuns | 0.0 /100 | #311 | Tragic 57.3% |
| Salvadorans | 0.0 /100 | #312 | Tragic 57.3% |
| Dutch West Indians | 0.0 /100 | #313 | Tragic 57.2% |
| Hopi | 0.0 /100 | #314 | Tragic 57.1% |
| Hondurans | 0.0 /100 | #315 | Tragic 57.1% |
| Menominee | 0.0 /100 | #316 | Tragic 57.0% |