Immigrants from Ethiopia vs Italian Associate's Degree
COMPARE
Immigrants from Ethiopia
Italian
Associate's Degree
Associate's Degree Comparison
Immigrants from Ethiopia
Italians
50.1%
ASSOCIATE'S DEGREE
98.7/ 100
METRIC RATING
90th/ 347
METRIC RANK
48.7%
ASSOCIATE'S DEGREE
93.9/ 100
METRIC RATING
122nd/ 347
METRIC RANK
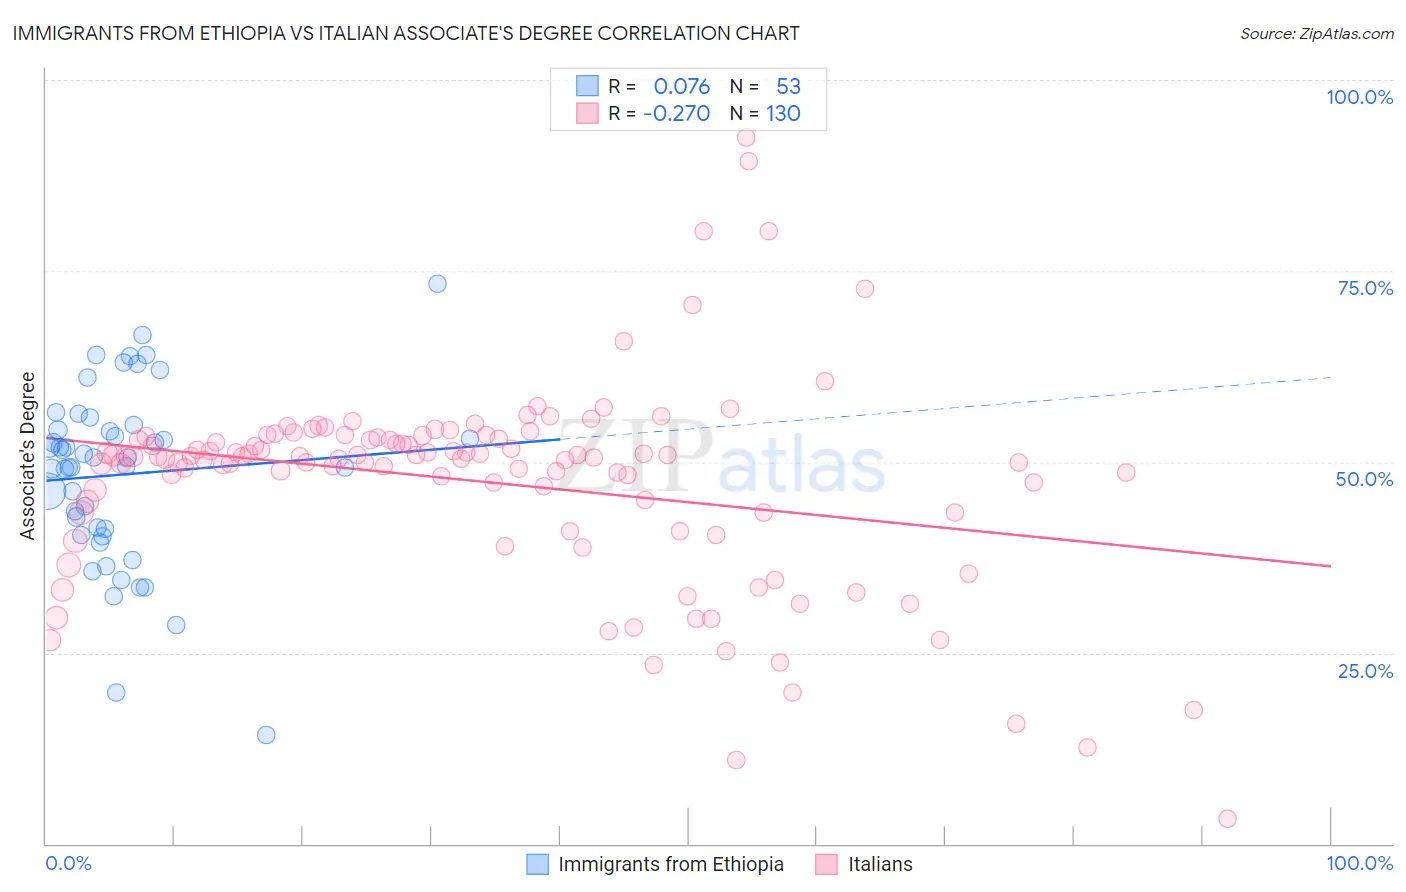
Immigrants from Ethiopia vs Italian Associate's Degree Correlation Chart
The statistical analysis conducted on geographies consisting of 211,548,755 people shows a slight positive correlation between the proportion of Immigrants from Ethiopia and percentage of population with at least associate's degree education in the United States with a correlation coefficient (R) of 0.076 and weighted average of 50.1%. Similarly, the statistical analysis conducted on geographies consisting of 575,016,726 people shows a weak negative correlation between the proportion of Italians and percentage of population with at least associate's degree education in the United States with a correlation coefficient (R) of -0.270 and weighted average of 48.7%, a difference of 2.9%.
Associate's Degree Correlation Summary
| Measurement | Immigrants from Ethiopia | Italian |
| Minimum | 14.3% | 3.2% |
| Maximum | 73.3% | 92.5% |
| Range | 59.0% | 89.3% |
| Mean | 48.3% | 47.4% |
| Median | 50.5% | 50.6% |
| Interquartile 25% (IQ1) | 40.9% | 43.4% |
| Interquartile 75% (IQ3) | 54.5% | 53.1% |
| Interquartile Range (IQR) | 13.7% | 9.7% |
| Standard Deviation (Sample) | 11.6% | 13.4% |
| Standard Deviation (Population) | 11.5% | 13.4% |
Similar Demographics by Associate's Degree
Demographics Similar to Immigrants from Ethiopia by Associate's Degree
In terms of associate's degree, the demographic groups most similar to Immigrants from Ethiopia are Immigrants from Canada (50.1%, a difference of 0.010%), Immigrants from Western Europe (50.1%, a difference of 0.010%), Immigrants from Moldova (50.2%, a difference of 0.080%), Immigrants from Western Asia (50.1%, a difference of 0.080%), and Immigrants from North America (50.1%, a difference of 0.10%).
| Demographics | Rating | Rank | Associate's Degree |
| Immigrants | Uzbekistan | 98.9 /100 | #83 | Exceptional 50.3% |
| Immigrants | Hungary | 98.9 /100 | #84 | Exceptional 50.2% |
| Immigrants | Egypt | 98.9 /100 | #85 | Exceptional 50.2% |
| Immigrants | Croatia | 98.9 /100 | #86 | Exceptional 50.2% |
| Immigrants | Moldova | 98.8 /100 | #87 | Exceptional 50.2% |
| Immigrants | Canada | 98.7 /100 | #88 | Exceptional 50.1% |
| Immigrants | Western Europe | 98.7 /100 | #89 | Exceptional 50.1% |
| Immigrants | Ethiopia | 98.7 /100 | #90 | Exceptional 50.1% |
| Immigrants | Western Asia | 98.7 /100 | #91 | Exceptional 50.1% |
| Immigrants | North America | 98.7 /100 | #92 | Exceptional 50.1% |
| Immigrants | Brazil | 98.5 /100 | #93 | Exceptional 50.0% |
| Laotians | 98.4 /100 | #94 | Exceptional 49.9% |
| Immigrants | England | 98.0 /100 | #95 | Exceptional 49.7% |
| Romanians | 98.0 /100 | #96 | Exceptional 49.7% |
| Immigrants | Ukraine | 98.0 /100 | #97 | Exceptional 49.7% |
Demographics Similar to Italians by Associate's Degree
In terms of associate's degree, the demographic groups most similar to Italians are Ugandan (48.7%, a difference of 0.0%), Brazilian (48.7%, a difference of 0.060%), Alsatian (48.8%, a difference of 0.23%), Lebanese (48.8%, a difference of 0.25%), and Albanian (48.8%, a difference of 0.26%).
| Demographics | Rating | Rank | Associate's Degree |
| Luxembourgers | 95.1 /100 | #115 | Exceptional 48.9% |
| British | 95.0 /100 | #116 | Exceptional 48.9% |
| Afghans | 94.8 /100 | #117 | Exceptional 48.9% |
| Albanians | 94.7 /100 | #118 | Exceptional 48.8% |
| Lebanese | 94.6 /100 | #119 | Exceptional 48.8% |
| Alsatians | 94.6 /100 | #120 | Exceptional 48.8% |
| Ugandans | 93.9 /100 | #121 | Exceptional 48.7% |
| Italians | 93.9 /100 | #122 | Exceptional 48.7% |
| Brazilians | 93.7 /100 | #123 | Exceptional 48.7% |
| Serbians | 92.6 /100 | #124 | Exceptional 48.5% |
| Chinese | 92.5 /100 | #125 | Exceptional 48.5% |
| Immigrants | Syria | 92.2 /100 | #126 | Exceptional 48.5% |
| Immigrants | Uganda | 92.1 /100 | #127 | Exceptional 48.5% |
| Immigrants | Eastern Africa | 91.6 /100 | #128 | Exceptional 48.4% |
| Swedes | 91.5 /100 | #129 | Exceptional 48.4% |