Apache vs Immigrants from Jamaica Bachelor's Degree
COMPARE
Apache
Immigrants from Jamaica
Bachelor's Degree
Bachelor's Degree Comparison
Apache
Immigrants from Jamaica
28.3%
BACHELOR'S DEGREE
0.0/ 100
METRIC RATING
326th/ 347
METRIC RANK
32.9%
BACHELOR'S DEGREE
0.5/ 100
METRIC RATING
262nd/ 347
METRIC RANK
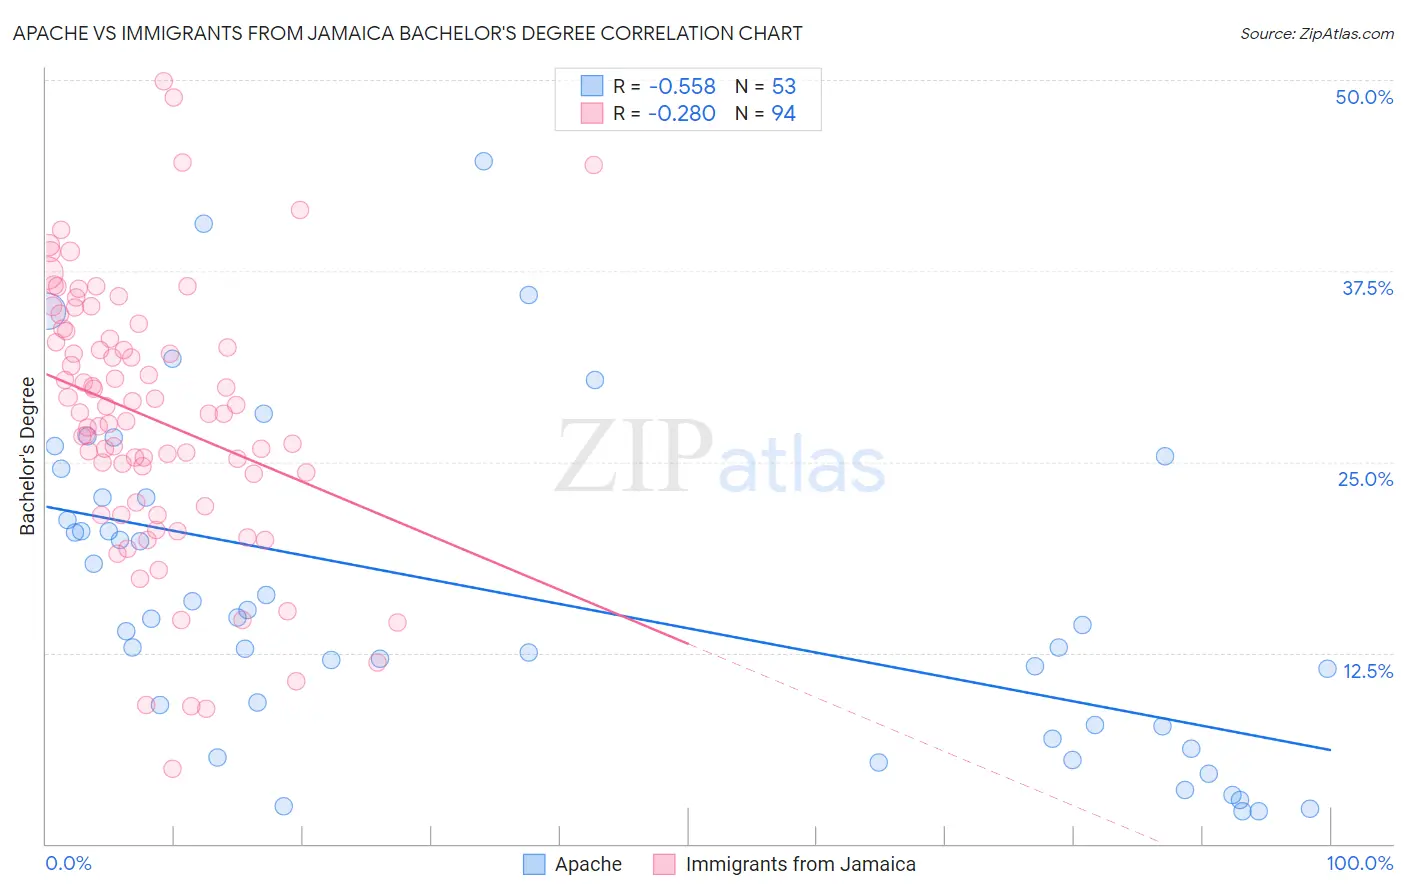
Apache vs Immigrants from Jamaica Bachelor's Degree Correlation Chart
The statistical analysis conducted on geographies consisting of 231,132,422 people shows a substantial negative correlation between the proportion of Apache and percentage of population with at least bachelor's degree education in the United States with a correlation coefficient (R) of -0.558 and weighted average of 28.3%. Similarly, the statistical analysis conducted on geographies consisting of 301,812,649 people shows a weak negative correlation between the proportion of Immigrants from Jamaica and percentage of population with at least bachelor's degree education in the United States with a correlation coefficient (R) of -0.280 and weighted average of 32.9%, a difference of 16.3%.
Bachelor's Degree Correlation Summary
| Measurement | Apache | Immigrants from Jamaica |
| Minimum | 2.1% | 4.9% |
| Maximum | 44.7% | 50.0% |
| Range | 42.5% | 45.0% |
| Mean | 16.1% | 27.9% |
| Median | 14.3% | 28.2% |
| Interquartile 25% (IQ1) | 7.3% | 22.3% |
| Interquartile 75% (IQ3) | 22.7% | 33.6% |
| Interquartile Range (IQR) | 15.4% | 11.2% |
| Standard Deviation (Sample) | 10.5% | 8.7% |
| Standard Deviation (Population) | 10.4% | 8.7% |
Similar Demographics by Bachelor's Degree
Demographics Similar to Apache by Bachelor's Degree
In terms of bachelor's degree, the demographic groups most similar to Apache are Pennsylvania German (28.4%, a difference of 0.39%), Paiute (28.1%, a difference of 0.67%), Dutch West Indian (28.5%, a difference of 0.84%), Fijian (28.7%, a difference of 1.6%), and Tsimshian (28.8%, a difference of 1.7%).
| Demographics | Rating | Rank | Bachelor's Degree |
| Creek | 0.0 /100 | #319 | Tragic 28.9% |
| Kiowa | 0.0 /100 | #320 | Tragic 28.8% |
| Alaskan Athabascans | 0.0 /100 | #321 | Tragic 28.8% |
| Tsimshian | 0.0 /100 | #322 | Tragic 28.8% |
| Fijians | 0.0 /100 | #323 | Tragic 28.7% |
| Dutch West Indians | 0.0 /100 | #324 | Tragic 28.5% |
| Pennsylvania Germans | 0.0 /100 | #325 | Tragic 28.4% |
| Apache | 0.0 /100 | #326 | Tragic 28.3% |
| Paiute | 0.0 /100 | #327 | Tragic 28.1% |
| Crow | 0.0 /100 | #328 | Tragic 27.7% |
| Immigrants | Central America | 0.0 /100 | #329 | Tragic 27.5% |
| Spanish American Indians | 0.0 /100 | #330 | Tragic 27.5% |
| Immigrants | Azores | 0.0 /100 | #331 | Tragic 27.3% |
| Menominee | 0.0 /100 | #332 | Tragic 27.3% |
| Mexicans | 0.0 /100 | #333 | Tragic 27.1% |
Demographics Similar to Immigrants from Jamaica by Bachelor's Degree
In terms of bachelor's degree, the demographic groups most similar to Immigrants from Jamaica are African (32.9%, a difference of 0.0%), Malaysian (32.9%, a difference of 0.090%), Belizean (32.8%, a difference of 0.29%), Osage (33.0%, a difference of 0.45%), and French American Indian (33.1%, a difference of 0.50%).
| Demographics | Rating | Rank | Bachelor's Degree |
| Iroquois | 0.7 /100 | #255 | Tragic 33.2% |
| Nicaraguans | 0.6 /100 | #256 | Tragic 33.1% |
| Spanish Americans | 0.6 /100 | #257 | Tragic 33.1% |
| French American Indians | 0.6 /100 | #258 | Tragic 33.1% |
| Osage | 0.5 /100 | #259 | Tragic 33.0% |
| Malaysians | 0.5 /100 | #260 | Tragic 32.9% |
| Africans | 0.5 /100 | #261 | Tragic 32.9% |
| Immigrants | Jamaica | 0.5 /100 | #262 | Tragic 32.9% |
| Belizeans | 0.4 /100 | #263 | Tragic 32.8% |
| Central American Indians | 0.3 /100 | #264 | Tragic 32.5% |
| Bahamians | 0.3 /100 | #265 | Tragic 32.5% |
| Immigrants | Dominica | 0.3 /100 | #266 | Tragic 32.5% |
| Cubans | 0.3 /100 | #267 | Tragic 32.5% |
| Immigrants | Portugal | 0.2 /100 | #268 | Tragic 32.2% |
| Immigrants | Belize | 0.2 /100 | #269 | Tragic 32.1% |