Immigrants from Southern Europe vs Immigrants from Jamaica Bachelor's Degree
COMPARE
Immigrants from Southern Europe
Immigrants from Jamaica
Bachelor's Degree
Bachelor's Degree Comparison
Immigrants from Southern Europe
Immigrants from Jamaica
40.0%
BACHELOR'S DEGREE
91.1/ 100
METRIC RATING
133rd/ 347
METRIC RANK
32.9%
BACHELOR'S DEGREE
0.5/ 100
METRIC RATING
262nd/ 347
METRIC RANK
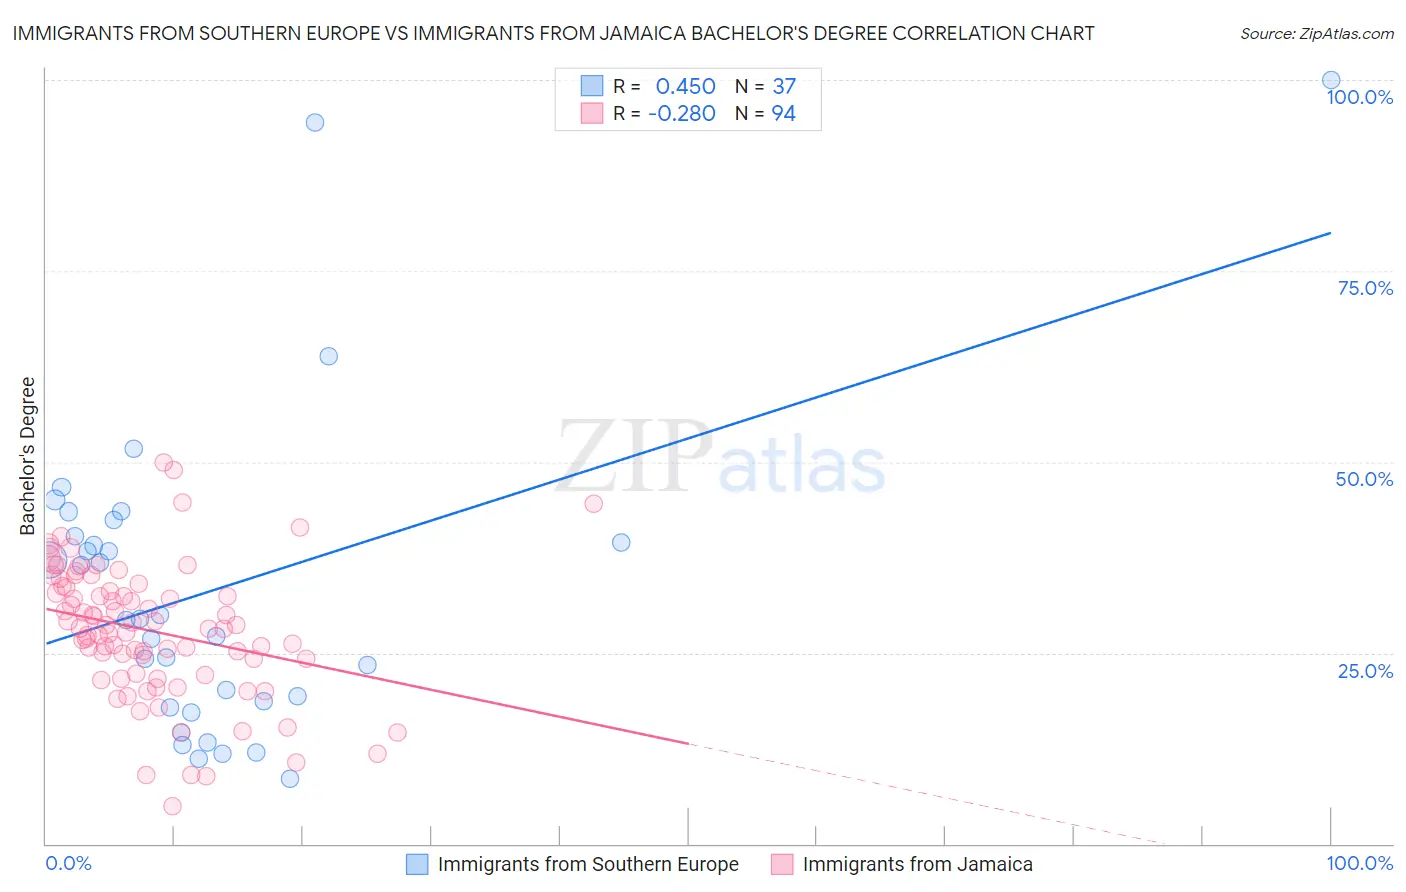
Immigrants from Southern Europe vs Immigrants from Jamaica Bachelor's Degree Correlation Chart
The statistical analysis conducted on geographies consisting of 402,787,541 people shows a moderate positive correlation between the proportion of Immigrants from Southern Europe and percentage of population with at least bachelor's degree education in the United States with a correlation coefficient (R) of 0.450 and weighted average of 40.0%. Similarly, the statistical analysis conducted on geographies consisting of 301,812,649 people shows a weak negative correlation between the proportion of Immigrants from Jamaica and percentage of population with at least bachelor's degree education in the United States with a correlation coefficient (R) of -0.280 and weighted average of 32.9%, a difference of 21.5%.
Bachelor's Degree Correlation Summary
| Measurement | Immigrants from Southern Europe | Immigrants from Jamaica |
| Minimum | 8.5% | 4.9% |
| Maximum | 100.0% | 50.0% |
| Range | 91.5% | 45.0% |
| Mean | 33.2% | 27.9% |
| Median | 29.4% | 28.2% |
| Interquartile 25% (IQ1) | 18.2% | 22.3% |
| Interquartile 75% (IQ3) | 41.4% | 33.6% |
| Interquartile Range (IQR) | 23.1% | 11.2% |
| Standard Deviation (Sample) | 20.4% | 8.7% |
| Standard Deviation (Population) | 20.1% | 8.7% |
Similar Demographics by Bachelor's Degree
Demographics Similar to Immigrants from Southern Europe by Bachelor's Degree
In terms of bachelor's degree, the demographic groups most similar to Immigrants from Southern Europe are Taiwanese (40.0%, a difference of 0.010%), Italian (40.1%, a difference of 0.25%), Sierra Leonean (40.1%, a difference of 0.33%), Serbian (40.1%, a difference of 0.40%), and Assyrian/Chaldean/Syriac (39.8%, a difference of 0.43%).
| Demographics | Rating | Rank | Bachelor's Degree |
| Immigrants | Eastern Africa | 94.1 /100 | #126 | Exceptional 40.4% |
| Immigrants | Jordan | 93.4 /100 | #127 | Exceptional 40.3% |
| Immigrants | Venezuela | 92.9 /100 | #128 | Exceptional 40.2% |
| Serbians | 92.4 /100 | #129 | Exceptional 40.1% |
| Sierra Leoneans | 92.2 /100 | #130 | Exceptional 40.1% |
| Italians | 91.9 /100 | #131 | Exceptional 40.1% |
| Taiwanese | 91.1 /100 | #132 | Exceptional 40.0% |
| Immigrants | Southern Europe | 91.1 /100 | #133 | Exceptional 40.0% |
| Assyrians/Chaldeans/Syriacs | 89.4 /100 | #134 | Excellent 39.8% |
| Luxembourgers | 89.1 /100 | #135 | Excellent 39.8% |
| Pakistanis | 88.2 /100 | #136 | Excellent 39.7% |
| Icelanders | 86.5 /100 | #137 | Excellent 39.5% |
| Europeans | 85.6 /100 | #138 | Excellent 39.5% |
| Immigrants | Sudan | 84.5 /100 | #139 | Excellent 39.4% |
| Immigrants | Armenia | 84.1 /100 | #140 | Excellent 39.4% |
Demographics Similar to Immigrants from Jamaica by Bachelor's Degree
In terms of bachelor's degree, the demographic groups most similar to Immigrants from Jamaica are African (32.9%, a difference of 0.0%), Malaysian (32.9%, a difference of 0.090%), Belizean (32.8%, a difference of 0.29%), Osage (33.0%, a difference of 0.45%), and French American Indian (33.1%, a difference of 0.50%).
| Demographics | Rating | Rank | Bachelor's Degree |
| Iroquois | 0.7 /100 | #255 | Tragic 33.2% |
| Nicaraguans | 0.6 /100 | #256 | Tragic 33.1% |
| Spanish Americans | 0.6 /100 | #257 | Tragic 33.1% |
| French American Indians | 0.6 /100 | #258 | Tragic 33.1% |
| Osage | 0.5 /100 | #259 | Tragic 33.0% |
| Malaysians | 0.5 /100 | #260 | Tragic 32.9% |
| Africans | 0.5 /100 | #261 | Tragic 32.9% |
| Immigrants | Jamaica | 0.5 /100 | #262 | Tragic 32.9% |
| Belizeans | 0.4 /100 | #263 | Tragic 32.8% |
| Central American Indians | 0.3 /100 | #264 | Tragic 32.5% |
| Bahamians | 0.3 /100 | #265 | Tragic 32.5% |
| Immigrants | Dominica | 0.3 /100 | #266 | Tragic 32.5% |
| Cubans | 0.3 /100 | #267 | Tragic 32.5% |
| Immigrants | Portugal | 0.2 /100 | #268 | Tragic 32.2% |
| Immigrants | Belize | 0.2 /100 | #269 | Tragic 32.1% |