Apache vs Immigrants from Ghana Bachelor's Degree
COMPARE
Apache
Immigrants from Ghana
Bachelor's Degree
Bachelor's Degree Comparison
Apache
Immigrants from Ghana
28.3%
BACHELOR'S DEGREE
0.0/ 100
METRIC RATING
326th/ 347
METRIC RANK
36.9%
BACHELOR'S DEGREE
27.4/ 100
METRIC RATING
200th/ 347
METRIC RANK
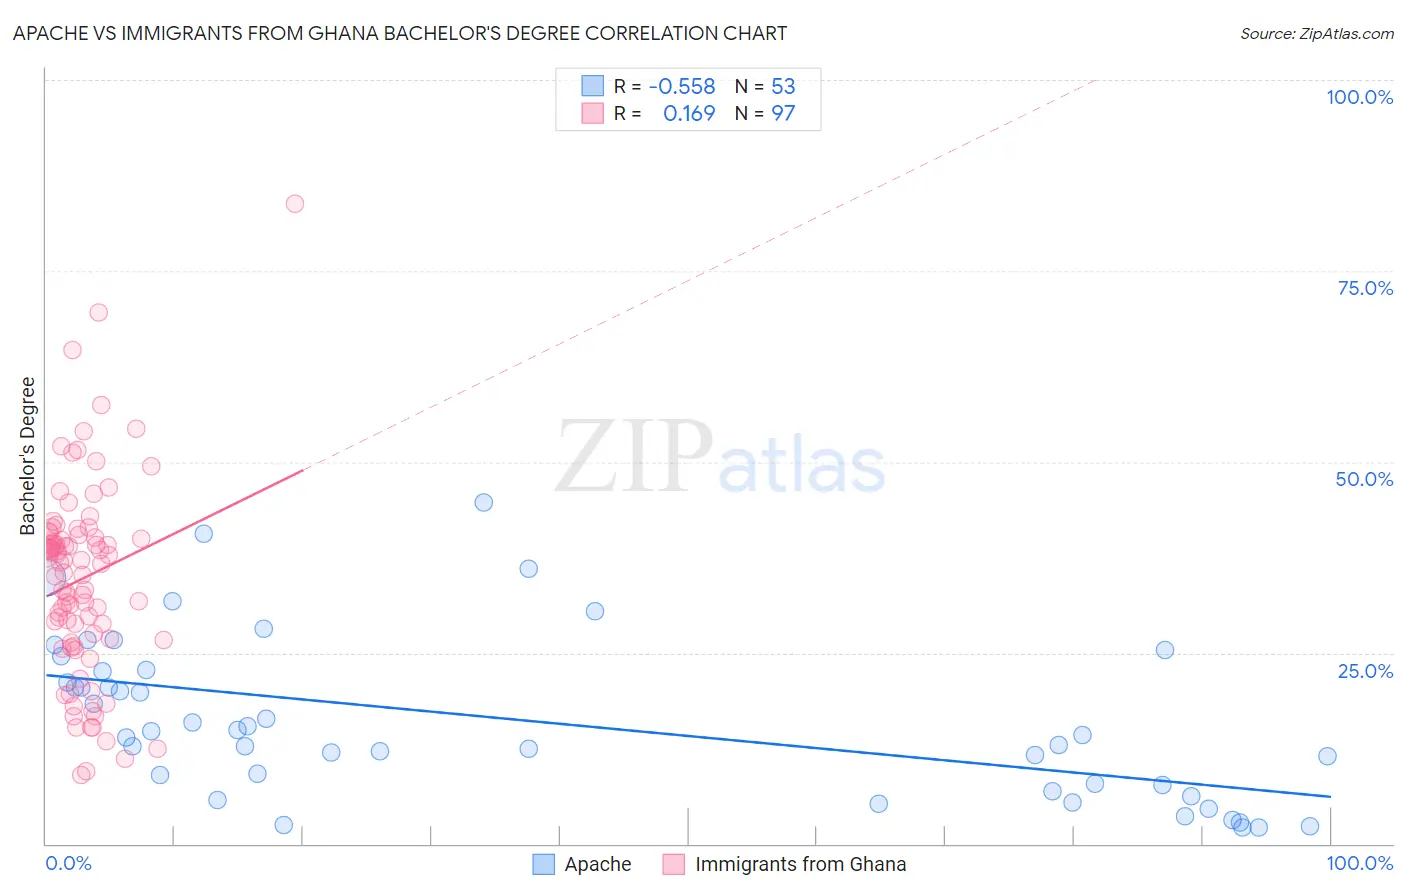
Apache vs Immigrants from Ghana Bachelor's Degree Correlation Chart
The statistical analysis conducted on geographies consisting of 231,132,422 people shows a substantial negative correlation between the proportion of Apache and percentage of population with at least bachelor's degree education in the United States with a correlation coefficient (R) of -0.558 and weighted average of 28.3%. Similarly, the statistical analysis conducted on geographies consisting of 199,935,745 people shows a poor positive correlation between the proportion of Immigrants from Ghana and percentage of population with at least bachelor's degree education in the United States with a correlation coefficient (R) of 0.169 and weighted average of 36.9%, a difference of 30.6%.
Bachelor's Degree Correlation Summary
| Measurement | Apache | Immigrants from Ghana |
| Minimum | 2.1% | 9.1% |
| Maximum | 44.7% | 83.8% |
| Range | 42.5% | 74.7% |
| Mean | 16.1% | 34.7% |
| Median | 14.3% | 36.8% |
| Interquartile 25% (IQ1) | 7.3% | 26.7% |
| Interquartile 75% (IQ3) | 22.7% | 40.3% |
| Interquartile Range (IQR) | 15.4% | 13.5% |
| Standard Deviation (Sample) | 10.5% | 12.8% |
| Standard Deviation (Population) | 10.4% | 12.7% |
Similar Demographics by Bachelor's Degree
Demographics Similar to Apache by Bachelor's Degree
In terms of bachelor's degree, the demographic groups most similar to Apache are Pennsylvania German (28.4%, a difference of 0.39%), Paiute (28.1%, a difference of 0.67%), Dutch West Indian (28.5%, a difference of 0.84%), Fijian (28.7%, a difference of 1.6%), and Tsimshian (28.8%, a difference of 1.7%).
| Demographics | Rating | Rank | Bachelor's Degree |
| Creek | 0.0 /100 | #319 | Tragic 28.9% |
| Kiowa | 0.0 /100 | #320 | Tragic 28.8% |
| Alaskan Athabascans | 0.0 /100 | #321 | Tragic 28.8% |
| Tsimshian | 0.0 /100 | #322 | Tragic 28.8% |
| Fijians | 0.0 /100 | #323 | Tragic 28.7% |
| Dutch West Indians | 0.0 /100 | #324 | Tragic 28.5% |
| Pennsylvania Germans | 0.0 /100 | #325 | Tragic 28.4% |
| Apache | 0.0 /100 | #326 | Tragic 28.3% |
| Paiute | 0.0 /100 | #327 | Tragic 28.1% |
| Crow | 0.0 /100 | #328 | Tragic 27.7% |
| Immigrants | Central America | 0.0 /100 | #329 | Tragic 27.5% |
| Spanish American Indians | 0.0 /100 | #330 | Tragic 27.5% |
| Immigrants | Azores | 0.0 /100 | #331 | Tragic 27.3% |
| Menominee | 0.0 /100 | #332 | Tragic 27.3% |
| Mexicans | 0.0 /100 | #333 | Tragic 27.1% |
Demographics Similar to Immigrants from Ghana by Bachelor's Degree
In terms of bachelor's degree, the demographic groups most similar to Immigrants from Ghana are Immigrants from Costa Rica (36.9%, a difference of 0.0%), Welsh (37.0%, a difference of 0.21%), Czechoslovakian (37.0%, a difference of 0.22%), Immigrants from South Eastern Asia (36.8%, a difference of 0.26%), and Celtic (37.0%, a difference of 0.27%).
| Demographics | Rating | Rank | Bachelor's Degree |
| Yugoslavians | 31.5 /100 | #193 | Fair 37.1% |
| Belgians | 29.9 /100 | #194 | Fair 37.0% |
| Koreans | 29.8 /100 | #195 | Fair 37.0% |
| Celtics | 29.5 /100 | #196 | Fair 37.0% |
| Czechoslovakians | 29.2 /100 | #197 | Fair 37.0% |
| Welsh | 29.1 /100 | #198 | Fair 37.0% |
| Immigrants | Costa Rica | 27.4 /100 | #199 | Fair 36.9% |
| Immigrants | Ghana | 27.4 /100 | #200 | Fair 36.9% |
| Immigrants | South Eastern Asia | 25.4 /100 | #201 | Fair 36.8% |
| Immigrants | Zaire | 25.3 /100 | #202 | Fair 36.8% |
| Immigrants | Nigeria | 23.1 /100 | #203 | Fair 36.7% |
| Immigrants | Immigrants | 22.8 /100 | #204 | Fair 36.7% |
| Finns | 22.2 /100 | #205 | Fair 36.7% |
| Spaniards | 21.2 /100 | #206 | Fair 36.6% |
| Immigrants | Middle Africa | 20.6 /100 | #207 | Fair 36.6% |