Immigrants from Somalia vs Immigrants from Jamaica Bachelor's Degree
COMPARE
Immigrants from Somalia
Immigrants from Jamaica
Bachelor's Degree
Bachelor's Degree Comparison
Immigrants from Somalia
Immigrants from Jamaica
37.9%
BACHELOR'S DEGREE
52.8/ 100
METRIC RATING
172nd/ 347
METRIC RANK
32.9%
BACHELOR'S DEGREE
0.5/ 100
METRIC RATING
262nd/ 347
METRIC RANK
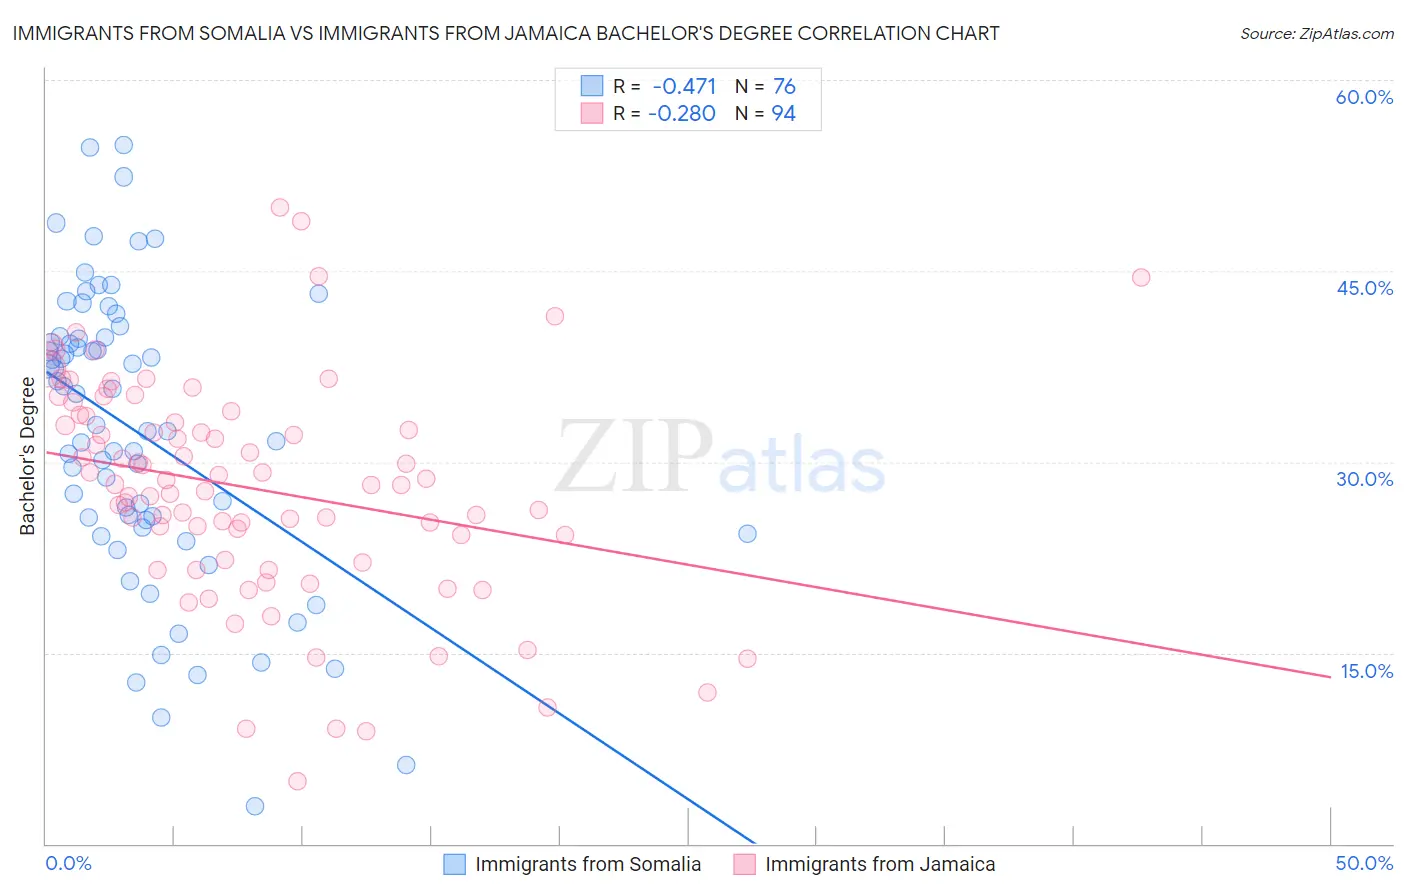
Immigrants from Somalia vs Immigrants from Jamaica Bachelor's Degree Correlation Chart
The statistical analysis conducted on geographies consisting of 92,111,755 people shows a moderate negative correlation between the proportion of Immigrants from Somalia and percentage of population with at least bachelor's degree education in the United States with a correlation coefficient (R) of -0.471 and weighted average of 37.9%. Similarly, the statistical analysis conducted on geographies consisting of 301,812,649 people shows a weak negative correlation between the proportion of Immigrants from Jamaica and percentage of population with at least bachelor's degree education in the United States with a correlation coefficient (R) of -0.280 and weighted average of 32.9%, a difference of 15.3%.
Bachelor's Degree Correlation Summary
| Measurement | Immigrants from Somalia | Immigrants from Jamaica |
| Minimum | 2.9% | 4.9% |
| Maximum | 54.9% | 50.0% |
| Range | 52.0% | 45.0% |
| Mean | 32.2% | 27.9% |
| Median | 32.7% | 28.2% |
| Interquartile 25% (IQ1) | 25.1% | 22.3% |
| Interquartile 75% (IQ3) | 39.7% | 33.6% |
| Interquartile Range (IQR) | 14.6% | 11.2% |
| Standard Deviation (Sample) | 11.4% | 8.7% |
| Standard Deviation (Population) | 11.3% | 8.7% |
Similar Demographics by Bachelor's Degree
Demographics Similar to Immigrants from Somalia by Bachelor's Degree
In terms of bachelor's degree, the demographic groups most similar to Immigrants from Somalia are Immigrants from Iraq (37.9%, a difference of 0.020%), Bermudan (38.0%, a difference of 0.14%), Czech (38.0%, a difference of 0.15%), Ghanaian (38.0%, a difference of 0.25%), and Immigrants from Bangladesh (37.8%, a difference of 0.27%).
| Demographics | Rating | Rank | Bachelor's Degree |
| Sri Lankans | 59.1 /100 | #165 | Average 38.2% |
| Somalis | 58.6 /100 | #166 | Average 38.1% |
| Scottish | 56.6 /100 | #167 | Average 38.1% |
| Danes | 56.2 /100 | #168 | Average 38.1% |
| Ghanaians | 55.3 /100 | #169 | Average 38.0% |
| Czechs | 54.4 /100 | #170 | Average 38.0% |
| Bermudans | 54.2 /100 | #171 | Average 38.0% |
| Immigrants | Somalia | 52.8 /100 | #172 | Average 37.9% |
| Immigrants | Iraq | 52.5 /100 | #173 | Average 37.9% |
| Immigrants | Bangladesh | 50.0 /100 | #174 | Average 37.8% |
| Immigrants | Uruguay | 48.3 /100 | #175 | Average 37.8% |
| Costa Ricans | 47.6 /100 | #176 | Average 37.7% |
| Basques | 47.4 /100 | #177 | Average 37.7% |
| Immigrants | Cameroon | 46.8 /100 | #178 | Average 37.7% |
| Immigrants | Colombia | 45.4 /100 | #179 | Average 37.7% |
Demographics Similar to Immigrants from Jamaica by Bachelor's Degree
In terms of bachelor's degree, the demographic groups most similar to Immigrants from Jamaica are African (32.9%, a difference of 0.0%), Malaysian (32.9%, a difference of 0.090%), Belizean (32.8%, a difference of 0.29%), Osage (33.0%, a difference of 0.45%), and French American Indian (33.1%, a difference of 0.50%).
| Demographics | Rating | Rank | Bachelor's Degree |
| Iroquois | 0.7 /100 | #255 | Tragic 33.2% |
| Nicaraguans | 0.6 /100 | #256 | Tragic 33.1% |
| Spanish Americans | 0.6 /100 | #257 | Tragic 33.1% |
| French American Indians | 0.6 /100 | #258 | Tragic 33.1% |
| Osage | 0.5 /100 | #259 | Tragic 33.0% |
| Malaysians | 0.5 /100 | #260 | Tragic 32.9% |
| Africans | 0.5 /100 | #261 | Tragic 32.9% |
| Immigrants | Jamaica | 0.5 /100 | #262 | Tragic 32.9% |
| Belizeans | 0.4 /100 | #263 | Tragic 32.8% |
| Central American Indians | 0.3 /100 | #264 | Tragic 32.5% |
| Bahamians | 0.3 /100 | #265 | Tragic 32.5% |
| Immigrants | Dominica | 0.3 /100 | #266 | Tragic 32.5% |
| Cubans | 0.3 /100 | #267 | Tragic 32.5% |
| Immigrants | Portugal | 0.2 /100 | #268 | Tragic 32.2% |
| Immigrants | Belize | 0.2 /100 | #269 | Tragic 32.1% |