Romanian vs Immigrants from Jamaica Bachelor's Degree
COMPARE
Romanian
Immigrants from Jamaica
Bachelor's Degree
Bachelor's Degree Comparison
Romanians
Immigrants from Jamaica
41.6%
BACHELOR'S DEGREE
98.4/ 100
METRIC RATING
97th/ 347
METRIC RANK
32.9%
BACHELOR'S DEGREE
0.5/ 100
METRIC RATING
262nd/ 347
METRIC RANK
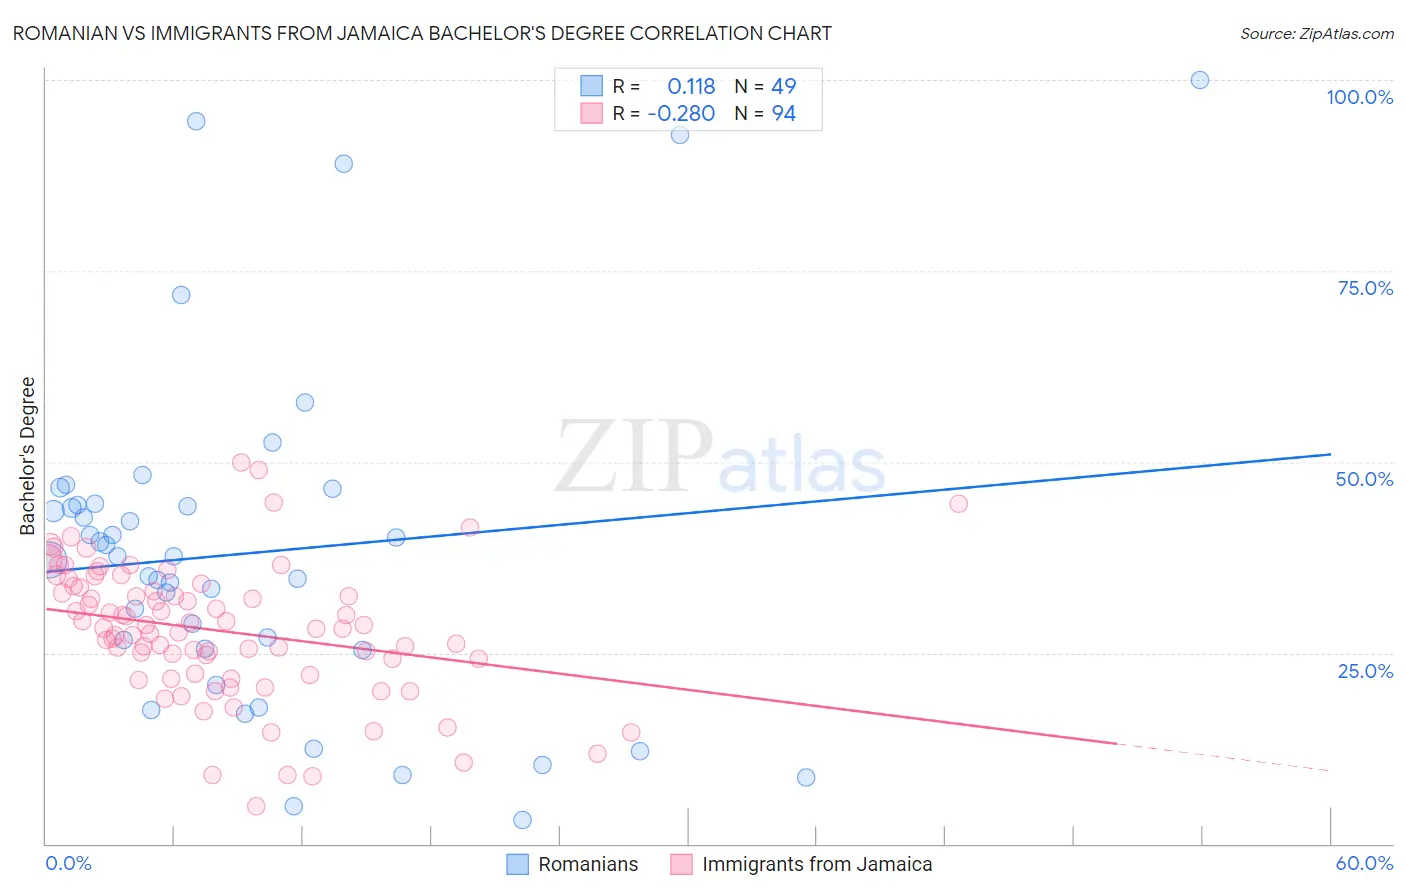
Romanian vs Immigrants from Jamaica Bachelor's Degree Correlation Chart
The statistical analysis conducted on geographies consisting of 377,865,873 people shows a poor positive correlation between the proportion of Romanians and percentage of population with at least bachelor's degree education in the United States with a correlation coefficient (R) of 0.118 and weighted average of 41.6%. Similarly, the statistical analysis conducted on geographies consisting of 301,812,649 people shows a weak negative correlation between the proportion of Immigrants from Jamaica and percentage of population with at least bachelor's degree education in the United States with a correlation coefficient (R) of -0.280 and weighted average of 32.9%, a difference of 26.4%.
Bachelor's Degree Correlation Summary
| Measurement | Romanian | Immigrants from Jamaica |
| Minimum | 3.1% | 4.9% |
| Maximum | 100.0% | 50.0% |
| Range | 96.9% | 45.0% |
| Mean | 38.1% | 27.9% |
| Median | 37.6% | 28.2% |
| Interquartile 25% (IQ1) | 25.5% | 22.3% |
| Interquartile 75% (IQ3) | 44.4% | 33.6% |
| Interquartile Range (IQR) | 18.9% | 11.2% |
| Standard Deviation (Sample) | 22.1% | 8.7% |
| Standard Deviation (Population) | 21.9% | 8.7% |
Similar Demographics by Bachelor's Degree
Demographics Similar to Romanians by Bachelor's Degree
In terms of bachelor's degree, the demographic groups most similar to Romanians are Immigrants from Moldova (41.6%, a difference of 0.050%), Immigrants from Ukraine (41.5%, a difference of 0.11%), Immigrants from North America (41.7%, a difference of 0.16%), Immigrants from Nepal (41.7%, a difference of 0.29%), and Immigrants from Canada (41.7%, a difference of 0.31%).
| Demographics | Rating | Rank | Bachelor's Degree |
| Laotians | 98.9 /100 | #90 | Exceptional 42.0% |
| Immigrants | Northern Africa | 98.9 /100 | #91 | Exceptional 41.9% |
| Maltese | 98.8 /100 | #92 | Exceptional 41.9% |
| Immigrants | Canada | 98.6 /100 | #93 | Exceptional 41.7% |
| Immigrants | Nepal | 98.6 /100 | #94 | Exceptional 41.7% |
| Immigrants | North America | 98.5 /100 | #95 | Exceptional 41.7% |
| Immigrants | Moldova | 98.4 /100 | #96 | Exceptional 41.6% |
| Romanians | 98.4 /100 | #97 | Exceptional 41.6% |
| Immigrants | Ukraine | 98.3 /100 | #98 | Exceptional 41.5% |
| Immigrants | England | 98.1 /100 | #99 | Exceptional 41.4% |
| Macedonians | 98.1 /100 | #100 | Exceptional 41.4% |
| Immigrants | Morocco | 98.0 /100 | #101 | Exceptional 41.4% |
| Immigrants | Italy | 97.8 /100 | #102 | Exceptional 41.3% |
| Chileans | 97.5 /100 | #103 | Exceptional 41.2% |
| Jordanians | 97.4 /100 | #104 | Exceptional 41.2% |
Demographics Similar to Immigrants from Jamaica by Bachelor's Degree
In terms of bachelor's degree, the demographic groups most similar to Immigrants from Jamaica are African (32.9%, a difference of 0.0%), Malaysian (32.9%, a difference of 0.090%), Belizean (32.8%, a difference of 0.29%), Osage (33.0%, a difference of 0.45%), and French American Indian (33.1%, a difference of 0.50%).
| Demographics | Rating | Rank | Bachelor's Degree |
| Iroquois | 0.7 /100 | #255 | Tragic 33.2% |
| Nicaraguans | 0.6 /100 | #256 | Tragic 33.1% |
| Spanish Americans | 0.6 /100 | #257 | Tragic 33.1% |
| French American Indians | 0.6 /100 | #258 | Tragic 33.1% |
| Osage | 0.5 /100 | #259 | Tragic 33.0% |
| Malaysians | 0.5 /100 | #260 | Tragic 32.9% |
| Africans | 0.5 /100 | #261 | Tragic 32.9% |
| Immigrants | Jamaica | 0.5 /100 | #262 | Tragic 32.9% |
| Belizeans | 0.4 /100 | #263 | Tragic 32.8% |
| Central American Indians | 0.3 /100 | #264 | Tragic 32.5% |
| Bahamians | 0.3 /100 | #265 | Tragic 32.5% |
| Immigrants | Dominica | 0.3 /100 | #266 | Tragic 32.5% |
| Cubans | 0.3 /100 | #267 | Tragic 32.5% |
| Immigrants | Portugal | 0.2 /100 | #268 | Tragic 32.2% |
| Immigrants | Belize | 0.2 /100 | #269 | Tragic 32.1% |