Bolivian vs Immigrants from Jamaica Bachelor's Degree
COMPARE
Bolivian
Immigrants from Jamaica
Bachelor's Degree
Bachelor's Degree Comparison
Bolivians
Immigrants from Jamaica
44.6%
BACHELOR'S DEGREE
99.9/ 100
METRIC RATING
47th/ 347
METRIC RANK
32.9%
BACHELOR'S DEGREE
0.5/ 100
METRIC RATING
262nd/ 347
METRIC RANK
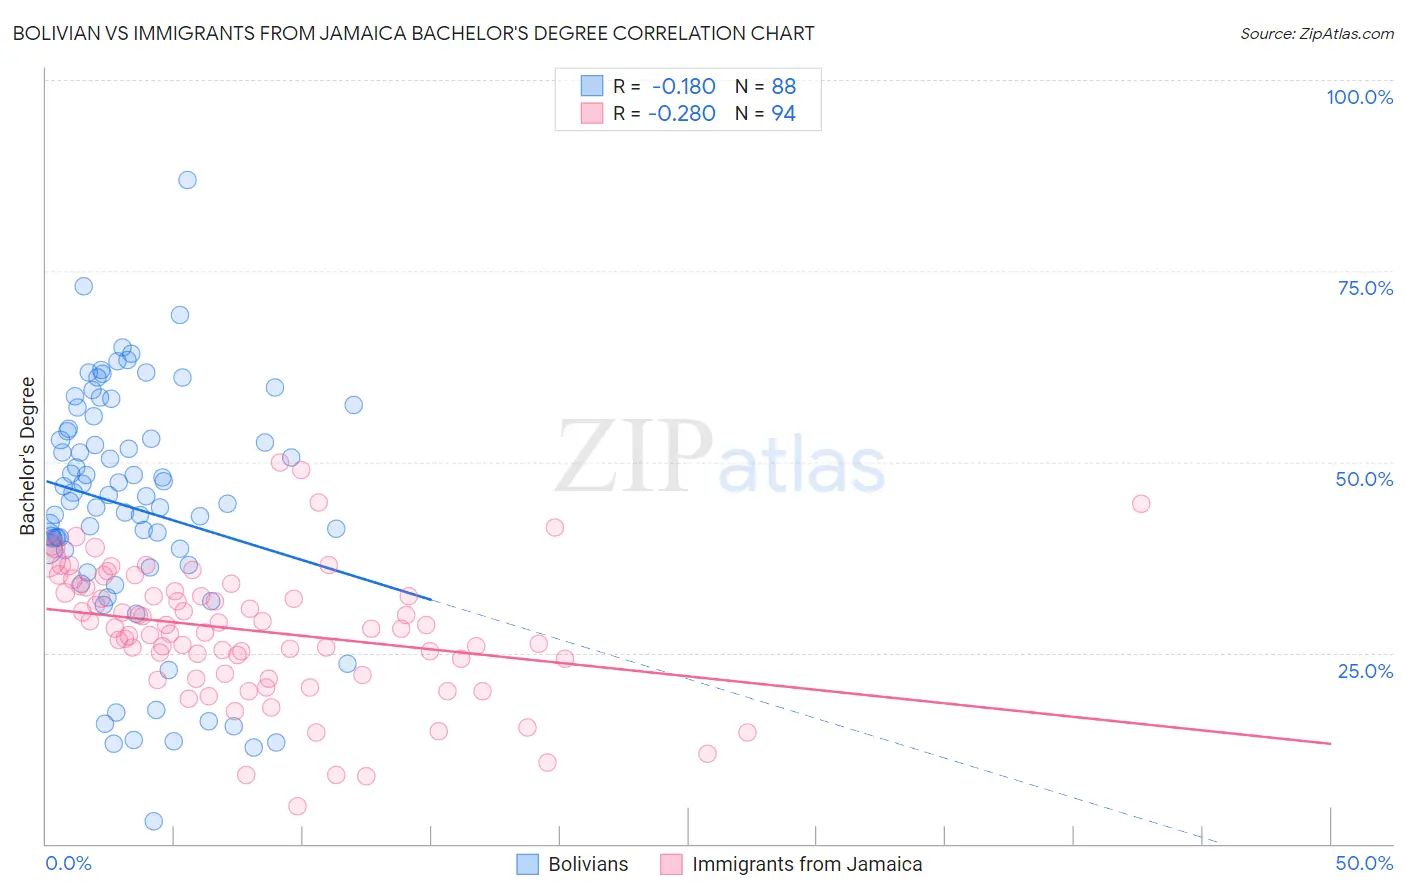
Bolivian vs Immigrants from Jamaica Bachelor's Degree Correlation Chart
The statistical analysis conducted on geographies consisting of 184,660,995 people shows a poor negative correlation between the proportion of Bolivians and percentage of population with at least bachelor's degree education in the United States with a correlation coefficient (R) of -0.180 and weighted average of 44.6%. Similarly, the statistical analysis conducted on geographies consisting of 301,812,649 people shows a weak negative correlation between the proportion of Immigrants from Jamaica and percentage of population with at least bachelor's degree education in the United States with a correlation coefficient (R) of -0.280 and weighted average of 32.9%, a difference of 35.5%.
Bachelor's Degree Correlation Summary
| Measurement | Bolivian | Immigrants from Jamaica |
| Minimum | 2.9% | 4.9% |
| Maximum | 86.9% | 50.0% |
| Range | 83.9% | 45.0% |
| Mean | 44.0% | 27.9% |
| Median | 45.2% | 28.2% |
| Interquartile 25% (IQ1) | 37.5% | 22.3% |
| Interquartile 75% (IQ3) | 54.2% | 33.6% |
| Interquartile Range (IQR) | 16.7% | 11.2% |
| Standard Deviation (Sample) | 15.8% | 8.7% |
| Standard Deviation (Population) | 15.7% | 8.7% |
Similar Demographics by Bachelor's Degree
Demographics Similar to Bolivians by Bachelor's Degree
In terms of bachelor's degree, the demographic groups most similar to Bolivians are Estonian (44.6%, a difference of 0.0%), Immigrants from Bulgaria (44.6%, a difference of 0.040%), Immigrants from Kuwait (44.6%, a difference of 0.090%), Immigrants from Lithuania (44.6%, a difference of 0.12%), and Immigrants from Norway (44.5%, a difference of 0.12%).
| Demographics | Rating | Rank | Bachelor's Degree |
| Immigrants | Belarus | 100.0 /100 | #40 | Exceptional 45.0% |
| Immigrants | Malaysia | 100.0 /100 | #41 | Exceptional 45.0% |
| Immigrants | Saudi Arabia | 100.0 /100 | #42 | Exceptional 44.8% |
| Immigrants | South Africa | 99.9 /100 | #43 | Exceptional 44.8% |
| Immigrants | Lithuania | 99.9 /100 | #44 | Exceptional 44.6% |
| Immigrants | Kuwait | 99.9 /100 | #45 | Exceptional 44.6% |
| Immigrants | Bulgaria | 99.9 /100 | #46 | Exceptional 44.6% |
| Bolivians | 99.9 /100 | #47 | Exceptional 44.6% |
| Estonians | 99.9 /100 | #48 | Exceptional 44.6% |
| Immigrants | Norway | 99.9 /100 | #49 | Exceptional 44.5% |
| Immigrants | Greece | 99.9 /100 | #50 | Exceptional 44.5% |
| Asians | 99.9 /100 | #51 | Exceptional 44.4% |
| Immigrants | Spain | 99.9 /100 | #52 | Exceptional 44.3% |
| Immigrants | Asia | 99.9 /100 | #53 | Exceptional 44.3% |
| Immigrants | Austria | 99.9 /100 | #54 | Exceptional 44.2% |
Demographics Similar to Immigrants from Jamaica by Bachelor's Degree
In terms of bachelor's degree, the demographic groups most similar to Immigrants from Jamaica are African (32.9%, a difference of 0.0%), Malaysian (32.9%, a difference of 0.090%), Belizean (32.8%, a difference of 0.29%), Osage (33.0%, a difference of 0.45%), and French American Indian (33.1%, a difference of 0.50%).
| Demographics | Rating | Rank | Bachelor's Degree |
| Iroquois | 0.7 /100 | #255 | Tragic 33.2% |
| Nicaraguans | 0.6 /100 | #256 | Tragic 33.1% |
| Spanish Americans | 0.6 /100 | #257 | Tragic 33.1% |
| French American Indians | 0.6 /100 | #258 | Tragic 33.1% |
| Osage | 0.5 /100 | #259 | Tragic 33.0% |
| Malaysians | 0.5 /100 | #260 | Tragic 32.9% |
| Africans | 0.5 /100 | #261 | Tragic 32.9% |
| Immigrants | Jamaica | 0.5 /100 | #262 | Tragic 32.9% |
| Belizeans | 0.4 /100 | #263 | Tragic 32.8% |
| Central American Indians | 0.3 /100 | #264 | Tragic 32.5% |
| Bahamians | 0.3 /100 | #265 | Tragic 32.5% |
| Immigrants | Dominica | 0.3 /100 | #266 | Tragic 32.5% |
| Cubans | 0.3 /100 | #267 | Tragic 32.5% |
| Immigrants | Portugal | 0.2 /100 | #268 | Tragic 32.2% |
| Immigrants | Belize | 0.2 /100 | #269 | Tragic 32.1% |