Immigrants from St. Vincent and the Grenadines vs Inupiat GED/Equivalency
COMPARE
Immigrants from St. Vincent and the Grenadines
Inupiat
GED/Equivalency
GED/Equivalency Comparison
Immigrants from St. Vincent and the Grenadines
Inupiat
82.0%
GED/EQUIVALENCY
0.0/ 100
METRIC RATING
294th/ 347
METRIC RANK
83.1%
GED/EQUIVALENCY
0.2/ 100
METRIC RATING
261st/ 347
METRIC RANK
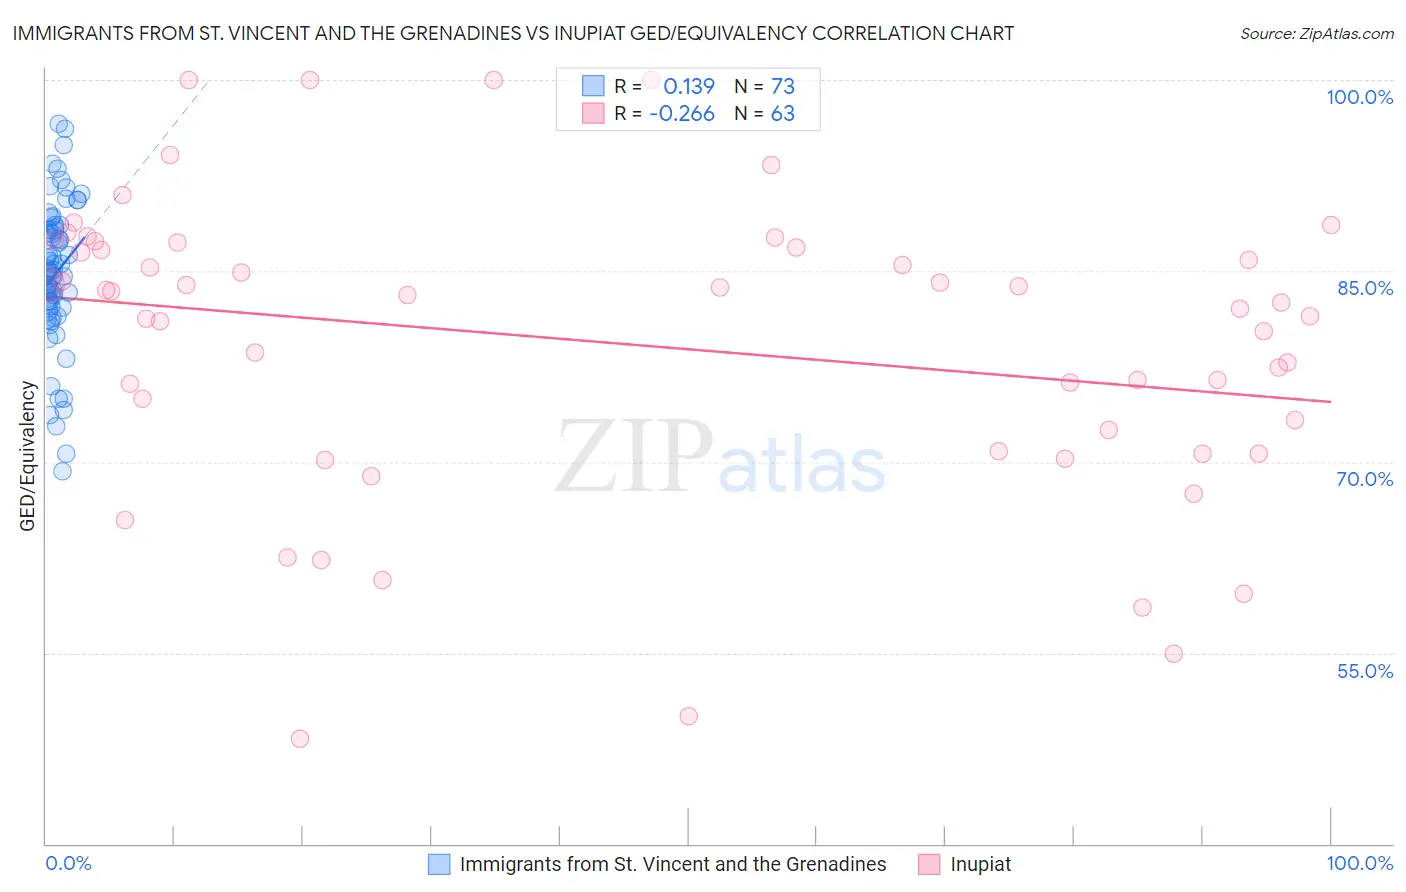
Immigrants from St. Vincent and the Grenadines vs Inupiat GED/Equivalency Correlation Chart
The statistical analysis conducted on geographies consisting of 56,191,418 people shows a poor positive correlation between the proportion of Immigrants from St. Vincent and the Grenadines and percentage of population with at least ged/equivalency education in the United States with a correlation coefficient (R) of 0.139 and weighted average of 82.0%. Similarly, the statistical analysis conducted on geographies consisting of 96,349,240 people shows a weak negative correlation between the proportion of Inupiat and percentage of population with at least ged/equivalency education in the United States with a correlation coefficient (R) of -0.266 and weighted average of 83.1%, a difference of 1.3%.
GED/Equivalency Correlation Summary
| Measurement | Immigrants from St. Vincent and the Grenadines | Inupiat |
| Minimum | 69.2% | 48.2% |
| Maximum | 96.6% | 100.0% |
| Range | 27.3% | 51.8% |
| Mean | 84.8% | 79.3% |
| Median | 85.0% | 82.5% |
| Interquartile 25% (IQ1) | 82.1% | 70.8% |
| Interquartile 75% (IQ3) | 88.3% | 86.8% |
| Interquartile Range (IQR) | 6.2% | 16.0% |
| Standard Deviation (Sample) | 5.6% | 11.7% |
| Standard Deviation (Population) | 5.6% | 11.6% |
Similar Demographics by GED/Equivalency
Demographics Similar to Immigrants from St. Vincent and the Grenadines by GED/Equivalency
In terms of ged/equivalency, the demographic groups most similar to Immigrants from St. Vincent and the Grenadines are Paiute (82.0%, a difference of 0.030%), British West Indian (82.0%, a difference of 0.030%), Nepalese (81.9%, a difference of 0.060%), Cuban (82.0%, a difference of 0.070%), and Haitian (82.1%, a difference of 0.090%).
| Demographics | Rating | Rank | GED/Equivalency |
| Japanese | 0.0 /100 | #287 | Tragic 82.4% |
| Pueblo | 0.0 /100 | #288 | Tragic 82.3% |
| Immigrants | Cambodia | 0.0 /100 | #289 | Tragic 82.2% |
| Haitians | 0.0 /100 | #290 | Tragic 82.1% |
| Cubans | 0.0 /100 | #291 | Tragic 82.0% |
| Paiute | 0.0 /100 | #292 | Tragic 82.0% |
| British West Indians | 0.0 /100 | #293 | Tragic 82.0% |
| Immigrants | St. Vincent and the Grenadines | 0.0 /100 | #294 | Tragic 82.0% |
| Nepalese | 0.0 /100 | #295 | Tragic 81.9% |
| Vietnamese | 0.0 /100 | #296 | Tragic 81.9% |
| Immigrants | Bangladesh | 0.0 /100 | #297 | Tragic 81.9% |
| Ute | 0.0 /100 | #298 | Tragic 81.8% |
| Ecuadorians | 0.0 /100 | #299 | Tragic 81.7% |
| Fijians | 0.0 /100 | #300 | Tragic 81.6% |
| Dutch West Indians | 0.0 /100 | #301 | Tragic 81.6% |
Demographics Similar to Inupiat by GED/Equivalency
In terms of ged/equivalency, the demographic groups most similar to Inupiat are Immigrants from Armenia (83.1%, a difference of 0.0%), Immigrants from Congo (83.1%, a difference of 0.010%), Bangladeshi (83.1%, a difference of 0.020%), West Indian (83.1%, a difference of 0.030%), and Kiowa (83.1%, a difference of 0.040%).
| Demographics | Rating | Rank | GED/Equivalency |
| Creek | 0.7 /100 | #254 | Tragic 83.6% |
| Colville | 0.5 /100 | #255 | Tragic 83.4% |
| Africans | 0.5 /100 | #256 | Tragic 83.4% |
| Jamaicans | 0.4 /100 | #257 | Tragic 83.3% |
| Malaysians | 0.4 /100 | #258 | Tragic 83.3% |
| Immigrants | Vietnam | 0.3 /100 | #259 | Tragic 83.2% |
| Choctaw | 0.3 /100 | #260 | Tragic 83.1% |
| Inupiat | 0.2 /100 | #261 | Tragic 83.1% |
| Immigrants | Armenia | 0.2 /100 | #262 | Tragic 83.1% |
| Immigrants | Congo | 0.2 /100 | #263 | Tragic 83.1% |
| Bangladeshis | 0.2 /100 | #264 | Tragic 83.1% |
| West Indians | 0.2 /100 | #265 | Tragic 83.1% |
| Kiowa | 0.2 /100 | #266 | Tragic 83.1% |
| Trinidadians and Tobagonians | 0.2 /100 | #267 | Tragic 83.0% |
| Immigrants | Burma/Myanmar | 0.2 /100 | #268 | Tragic 83.0% |