Alsatian vs Inupiat In Labor Force | Age 25-29
COMPARE
Alsatian
Inupiat
In Labor Force | Age 25-29
In Labor Force | Age 25-29 Comparison
Alsatians
Inupiat
83.9%
IN LABOR FORCE | AGE 25-29
0.7/ 100
METRIC RATING
241st/ 347
METRIC RANK
79.8%
IN LABOR FORCE | AGE 25-29
0.0/ 100
METRIC RATING
332nd/ 347
METRIC RANK
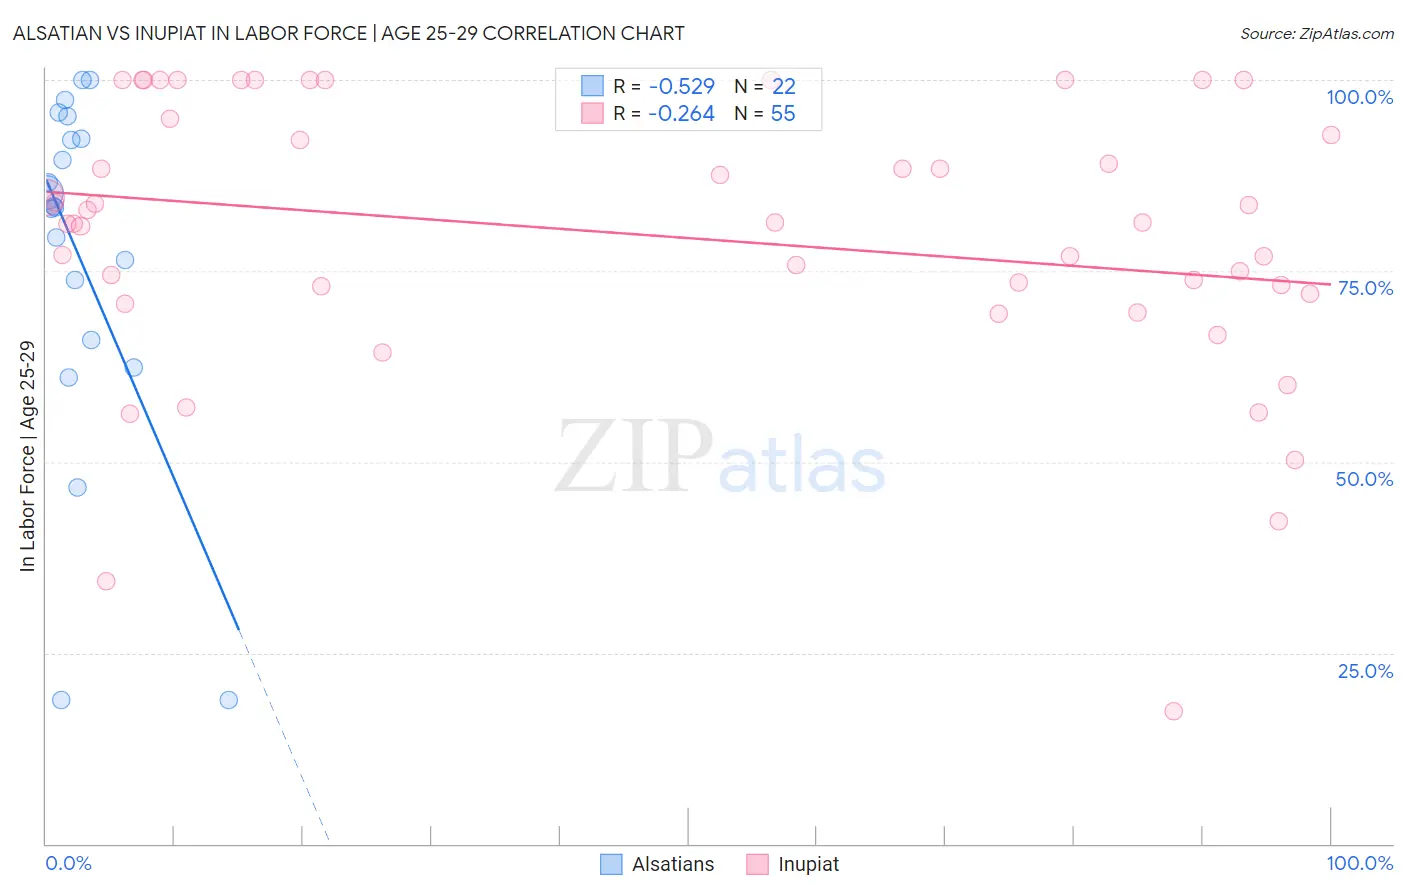
Alsatian vs Inupiat In Labor Force | Age 25-29 Correlation Chart
The statistical analysis conducted on geographies consisting of 82,674,236 people shows a substantial negative correlation between the proportion of Alsatians and labor force participation rate among population between the ages 25 and 29 in the United States with a correlation coefficient (R) of -0.529 and weighted average of 83.9%. Similarly, the statistical analysis conducted on geographies consisting of 96,328,629 people shows a weak negative correlation between the proportion of Inupiat and labor force participation rate among population between the ages 25 and 29 in the United States with a correlation coefficient (R) of -0.264 and weighted average of 79.8%, a difference of 5.2%.
In Labor Force | Age 25-29 Correlation Summary
| Measurement | Alsatian | Inupiat |
| Minimum | 18.8% | 17.4% |
| Maximum | 100.0% | 100.0% |
| Range | 81.2% | 82.6% |
| Mean | 76.7% | 79.7% |
| Median | 83.4% | 81.3% |
| Interquartile 25% (IQ1) | 66.0% | 72.0% |
| Interquartile 75% (IQ3) | 92.3% | 94.9% |
| Interquartile Range (IQR) | 26.3% | 22.9% |
| Standard Deviation (Sample) | 23.2% | 18.0% |
| Standard Deviation (Population) | 22.7% | 17.9% |
Similar Demographics by In Labor Force | Age 25-29
Demographics Similar to Alsatians by In Labor Force | Age 25-29
In terms of in labor force | age 25-29, the demographic groups most similar to Alsatians are Trinidadian and Tobagonian (83.9%, a difference of 0.020%), Immigrants from Uzbekistan (83.9%, a difference of 0.030%), Jamaican (83.9%, a difference of 0.030%), U.S. Virgin Islander (83.8%, a difference of 0.030%), and Salvadoran (83.8%, a difference of 0.040%).
| Demographics | Rating | Rank | In Labor Force | Age 25-29 |
| Barbadians | 1.0 /100 | #234 | Tragic 83.9% |
| Iraqis | 0.9 /100 | #235 | Tragic 83.9% |
| Guamanians/Chamorros | 0.9 /100 | #236 | Tragic 83.9% |
| Immigrants | Immigrants | 0.9 /100 | #237 | Tragic 83.9% |
| Immigrants | Uzbekistan | 0.8 /100 | #238 | Tragic 83.9% |
| Jamaicans | 0.8 /100 | #239 | Tragic 83.9% |
| Trinidadians and Tobagonians | 0.7 /100 | #240 | Tragic 83.9% |
| Alsatians | 0.7 /100 | #241 | Tragic 83.9% |
| U.S. Virgin Islanders | 0.6 /100 | #242 | Tragic 83.8% |
| Salvadorans | 0.5 /100 | #243 | Tragic 83.8% |
| Immigrants | Jamaica | 0.4 /100 | #244 | Tragic 83.8% |
| Iroquois | 0.4 /100 | #245 | Tragic 83.8% |
| Cree | 0.3 /100 | #246 | Tragic 83.8% |
| Immigrants | El Salvador | 0.3 /100 | #247 | Tragic 83.7% |
| Immigrants | Nonimmigrants | 0.3 /100 | #248 | Tragic 83.7% |
Demographics Similar to Inupiat by In Labor Force | Age 25-29
In terms of in labor force | age 25-29, the demographic groups most similar to Inupiat are Sioux (79.7%, a difference of 0.11%), Yuman (79.3%, a difference of 0.53%), Native/Alaskan (79.3%, a difference of 0.61%), Apache (79.2%, a difference of 0.68%), and Cheyenne (80.3%, a difference of 0.69%).
| Demographics | Rating | Rank | In Labor Force | Age 25-29 |
| Dutch West Indians | 0.0 /100 | #325 | Tragic 81.1% |
| Choctaw | 0.0 /100 | #326 | Tragic 81.0% |
| Ute | 0.0 /100 | #327 | Tragic 80.8% |
| Creek | 0.0 /100 | #328 | Tragic 80.7% |
| Yakama | 0.0 /100 | #329 | Tragic 80.6% |
| Puerto Ricans | 0.0 /100 | #330 | Tragic 80.4% |
| Cheyenne | 0.0 /100 | #331 | Tragic 80.3% |
| Inupiat | 0.0 /100 | #332 | Tragic 79.8% |
| Sioux | 0.0 /100 | #333 | Tragic 79.7% |
| Yuman | 0.0 /100 | #334 | Tragic 79.3% |
| Natives/Alaskans | 0.0 /100 | #335 | Tragic 79.3% |
| Apache | 0.0 /100 | #336 | Tragic 79.2% |
| Crow | 0.0 /100 | #337 | Tragic 78.6% |
| Lumbee | 0.0 /100 | #338 | Tragic 78.3% |
| Immigrants | Yemen | 0.0 /100 | #339 | Tragic 78.2% |