Armenian vs Inupiat GED/Equivalency
COMPARE
Armenian
Inupiat
GED/Equivalency
GED/Equivalency Comparison
Armenians
Inupiat
86.3%
GED/EQUIVALENCY
76.4/ 100
METRIC RATING
154th/ 347
METRIC RANK
83.1%
GED/EQUIVALENCY
0.2/ 100
METRIC RATING
261st/ 347
METRIC RANK
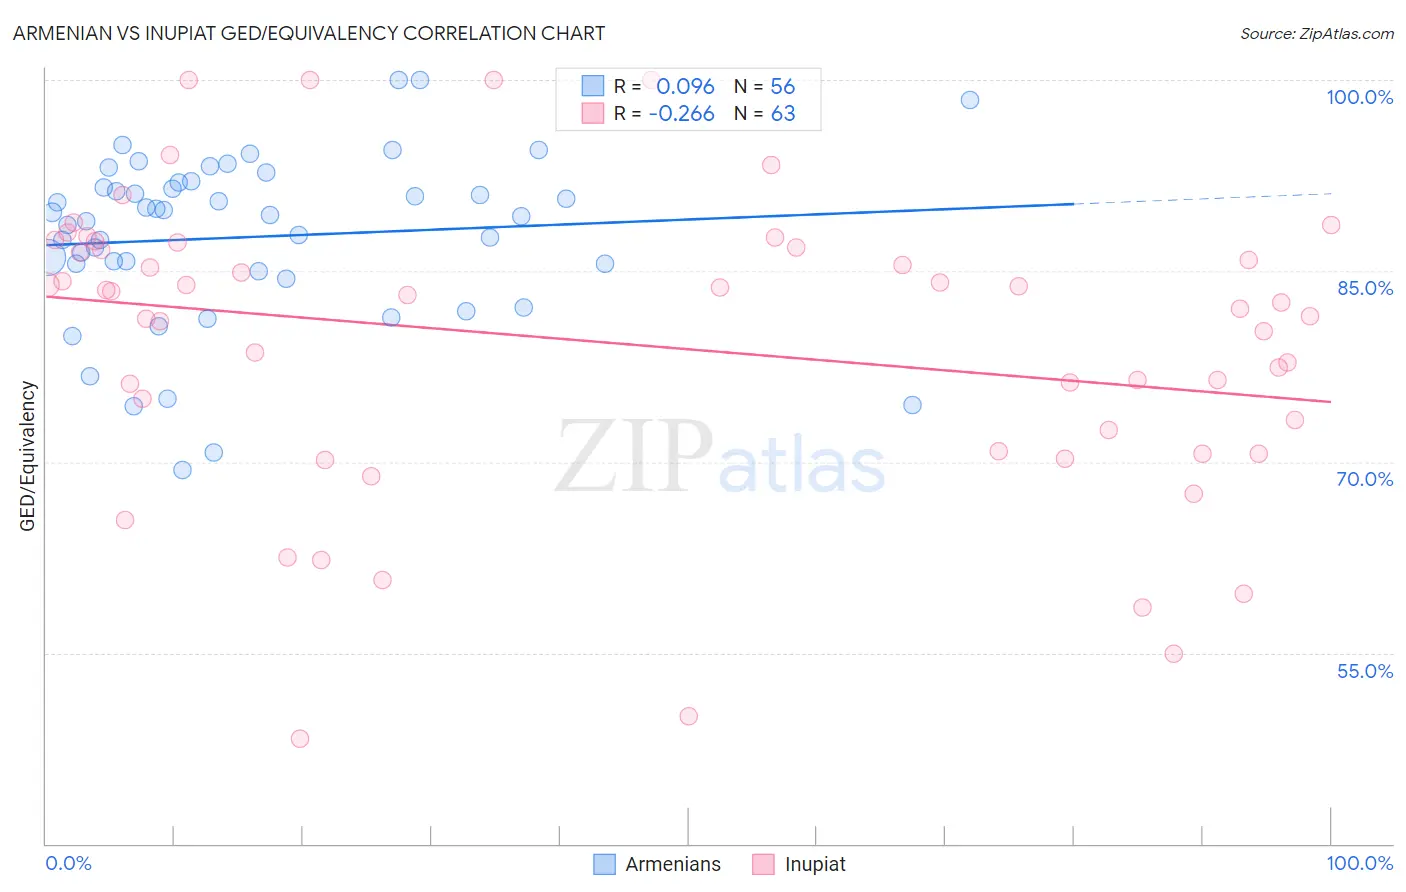
Armenian vs Inupiat GED/Equivalency Correlation Chart
The statistical analysis conducted on geographies consisting of 310,954,685 people shows a slight positive correlation between the proportion of Armenians and percentage of population with at least ged/equivalency education in the United States with a correlation coefficient (R) of 0.096 and weighted average of 86.3%. Similarly, the statistical analysis conducted on geographies consisting of 96,349,240 people shows a weak negative correlation between the proportion of Inupiat and percentage of population with at least ged/equivalency education in the United States with a correlation coefficient (R) of -0.266 and weighted average of 83.1%, a difference of 3.8%.
GED/Equivalency Correlation Summary
| Measurement | Armenian | Inupiat |
| Minimum | 69.3% | 48.2% |
| Maximum | 100.0% | 100.0% |
| Range | 30.7% | 51.8% |
| Mean | 87.7% | 79.3% |
| Median | 89.3% | 82.5% |
| Interquartile 25% (IQ1) | 85.3% | 70.8% |
| Interquartile 75% (IQ3) | 91.8% | 86.8% |
| Interquartile Range (IQR) | 6.5% | 16.0% |
| Standard Deviation (Sample) | 6.7% | 11.7% |
| Standard Deviation (Population) | 6.7% | 11.6% |
Similar Demographics by GED/Equivalency
Demographics Similar to Armenians by GED/Equivalency
In terms of ged/equivalency, the demographic groups most similar to Armenians are Kenyan (86.3%, a difference of 0.0%), Brazilian (86.3%, a difference of 0.020%), Iraqi (86.2%, a difference of 0.030%), Immigrants from Bosnia and Herzegovina (86.3%, a difference of 0.040%), and Immigrants from Western Asia (86.3%, a difference of 0.070%).
| Demographics | Rating | Rank | GED/Equivalency |
| Immigrants | Northern Africa | 79.3 /100 | #147 | Good 86.3% |
| Immigrants | Poland | 79.3 /100 | #148 | Good 86.3% |
| Menominee | 79.3 /100 | #149 | Good 86.3% |
| Immigrants | Western Asia | 78.8 /100 | #150 | Good 86.3% |
| Immigrants | Bosnia and Herzegovina | 77.9 /100 | #151 | Good 86.3% |
| Brazilians | 77.2 /100 | #152 | Good 86.3% |
| Kenyans | 76.6 /100 | #153 | Good 86.3% |
| Armenians | 76.4 /100 | #154 | Good 86.3% |
| Iraqis | 75.2 /100 | #155 | Good 86.2% |
| Immigrants | Nepal | 73.3 /100 | #156 | Good 86.2% |
| Whites/Caucasians | 72.2 /100 | #157 | Good 86.2% |
| German Russians | 72.1 /100 | #158 | Good 86.2% |
| Immigrants | Kenya | 71.8 /100 | #159 | Good 86.2% |
| Immigrants | Morocco | 69.5 /100 | #160 | Good 86.1% |
| Immigrants | Syria | 69.3 /100 | #161 | Good 86.1% |
Demographics Similar to Inupiat by GED/Equivalency
In terms of ged/equivalency, the demographic groups most similar to Inupiat are Immigrants from Armenia (83.1%, a difference of 0.0%), Immigrants from Congo (83.1%, a difference of 0.010%), Bangladeshi (83.1%, a difference of 0.020%), West Indian (83.1%, a difference of 0.030%), and Kiowa (83.1%, a difference of 0.040%).
| Demographics | Rating | Rank | GED/Equivalency |
| Creek | 0.7 /100 | #254 | Tragic 83.6% |
| Colville | 0.5 /100 | #255 | Tragic 83.4% |
| Africans | 0.5 /100 | #256 | Tragic 83.4% |
| Jamaicans | 0.4 /100 | #257 | Tragic 83.3% |
| Malaysians | 0.4 /100 | #258 | Tragic 83.3% |
| Immigrants | Vietnam | 0.3 /100 | #259 | Tragic 83.2% |
| Choctaw | 0.3 /100 | #260 | Tragic 83.1% |
| Inupiat | 0.2 /100 | #261 | Tragic 83.1% |
| Immigrants | Armenia | 0.2 /100 | #262 | Tragic 83.1% |
| Immigrants | Congo | 0.2 /100 | #263 | Tragic 83.1% |
| Bangladeshis | 0.2 /100 | #264 | Tragic 83.1% |
| West Indians | 0.2 /100 | #265 | Tragic 83.1% |
| Kiowa | 0.2 /100 | #266 | Tragic 83.1% |
| Trinidadians and Tobagonians | 0.2 /100 | #267 | Tragic 83.0% |
| Immigrants | Burma/Myanmar | 0.2 /100 | #268 | Tragic 83.0% |