Immigrants from Thailand vs Immigrants from Jordan 10th Grade
COMPARE
Immigrants from Thailand
Immigrants from Jordan
10th Grade
10th Grade Comparison
Immigrants from Thailand
Immigrants from Jordan
92.8%
10TH GRADE
1.0/ 100
METRIC RATING
251st/ 347
METRIC RANK
94.1%
10TH GRADE
87.6/ 100
METRIC RATING
140th/ 347
METRIC RANK
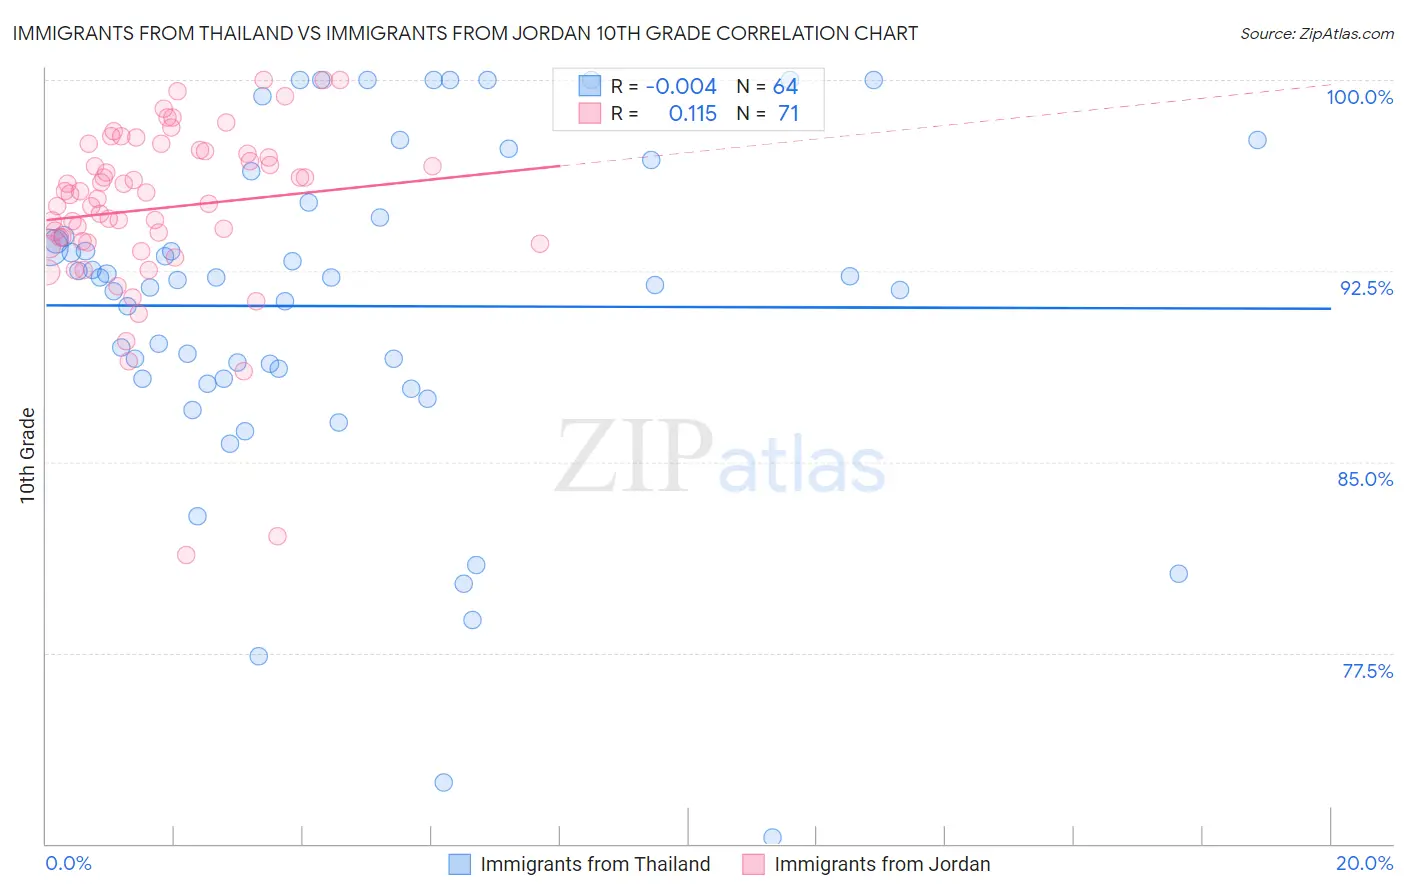
Immigrants from Thailand vs Immigrants from Jordan 10th Grade Correlation Chart
The statistical analysis conducted on geographies consisting of 317,022,916 people shows no correlation between the proportion of Immigrants from Thailand and percentage of population with at least 10th grade education in the United States with a correlation coefficient (R) of -0.004 and weighted average of 92.8%. Similarly, the statistical analysis conducted on geographies consisting of 181,278,272 people shows a poor positive correlation between the proportion of Immigrants from Jordan and percentage of population with at least 10th grade education in the United States with a correlation coefficient (R) of 0.115 and weighted average of 94.1%, a difference of 1.5%.
10th Grade Correlation Summary
| Measurement | Immigrants from Thailand | Immigrants from Jordan |
| Minimum | 70.3% | 81.3% |
| Maximum | 100.0% | 100.0% |
| Range | 29.7% | 18.7% |
| Mean | 91.1% | 95.0% |
| Median | 92.2% | 95.5% |
| Interquartile 25% (IQ1) | 88.3% | 93.6% |
| Interquartile 75% (IQ3) | 94.9% | 97.2% |
| Interquartile Range (IQR) | 6.6% | 3.6% |
| Standard Deviation (Sample) | 6.6% | 3.4% |
| Standard Deviation (Population) | 6.5% | 3.4% |
Similar Demographics by 10th Grade
Demographics Similar to Immigrants from Thailand by 10th Grade
In terms of 10th grade, the demographic groups most similar to Immigrants from Thailand are South American (92.8%, a difference of 0.010%), Ghanaian (92.8%, a difference of 0.010%), Armenian (92.7%, a difference of 0.020%), Jamaican (92.8%, a difference of 0.050%), and Immigrants from Bolivia (92.7%, a difference of 0.070%).
| Demographics | Rating | Rank | 10th Grade |
| Spanish Americans | 2.1 /100 | #244 | Tragic 92.9% |
| Uruguayans | 1.8 /100 | #245 | Tragic 92.9% |
| Immigrants | Middle Africa | 1.7 /100 | #246 | Tragic 92.9% |
| Immigrants | Afghanistan | 1.4 /100 | #247 | Tragic 92.8% |
| Colombians | 1.4 /100 | #248 | Tragic 92.8% |
| Immigrants | Senegal | 1.4 /100 | #249 | Tragic 92.8% |
| Jamaicans | 1.2 /100 | #250 | Tragic 92.8% |
| Immigrants | Thailand | 1.0 /100 | #251 | Tragic 92.8% |
| South Americans | 0.9 /100 | #252 | Tragic 92.8% |
| Ghanaians | 0.9 /100 | #253 | Tragic 92.8% |
| Armenians | 0.9 /100 | #254 | Tragic 92.7% |
| Immigrants | Bolivia | 0.7 /100 | #255 | Tragic 92.7% |
| Immigrants | Nigeria | 0.7 /100 | #256 | Tragic 92.7% |
| U.S. Virgin Islanders | 0.7 /100 | #257 | Tragic 92.7% |
| Immigrants | Costa Rica | 0.6 /100 | #258 | Tragic 92.7% |
Demographics Similar to Immigrants from Jordan by 10th Grade
In terms of 10th grade, the demographic groups most similar to Immigrants from Jordan are Hmong (94.1%, a difference of 0.020%), Albanian (94.1%, a difference of 0.020%), Immigrants from Bosnia and Herzegovina (94.2%, a difference of 0.040%), Immigrants from Sri Lanka (94.2%, a difference of 0.050%), and Cherokee (94.1%, a difference of 0.050%).
| Demographics | Rating | Rank | 10th Grade |
| Creek | 91.9 /100 | #133 | Exceptional 94.2% |
| Osage | 91.7 /100 | #134 | Exceptional 94.2% |
| Immigrants | Korea | 91.3 /100 | #135 | Exceptional 94.2% |
| Shoshone | 90.8 /100 | #136 | Exceptional 94.2% |
| Arapaho | 90.5 /100 | #137 | Exceptional 94.2% |
| Immigrants | Sri Lanka | 89.9 /100 | #138 | Excellent 94.2% |
| Immigrants | Bosnia and Herzegovina | 89.4 /100 | #139 | Excellent 94.2% |
| Immigrants | Jordan | 87.6 /100 | #140 | Excellent 94.1% |
| Hmong | 86.6 /100 | #141 | Excellent 94.1% |
| Albanians | 86.5 /100 | #142 | Excellent 94.1% |
| Cherokee | 84.9 /100 | #143 | Excellent 94.1% |
| Immigrants | Kazakhstan | 84.9 /100 | #144 | Excellent 94.1% |
| Immigrants | Nonimmigrants | 83.8 /100 | #145 | Excellent 94.1% |
| Chickasaw | 82.6 /100 | #146 | Excellent 94.1% |
| Immigrants | Ukraine | 81.5 /100 | #147 | Excellent 94.0% |