Alsatian vs Tlingit-Haida 10th Grade
COMPARE
Alsatian
Tlingit-Haida
10th Grade
10th Grade Comparison
Alsatians
Tlingit-Haida
93.8%
10TH GRADE
59.4/ 100
METRIC RATING
168th/ 347
METRIC RANK
95.7%
10TH GRADE
100.0/ 100
METRIC RATING
12th/ 347
METRIC RANK
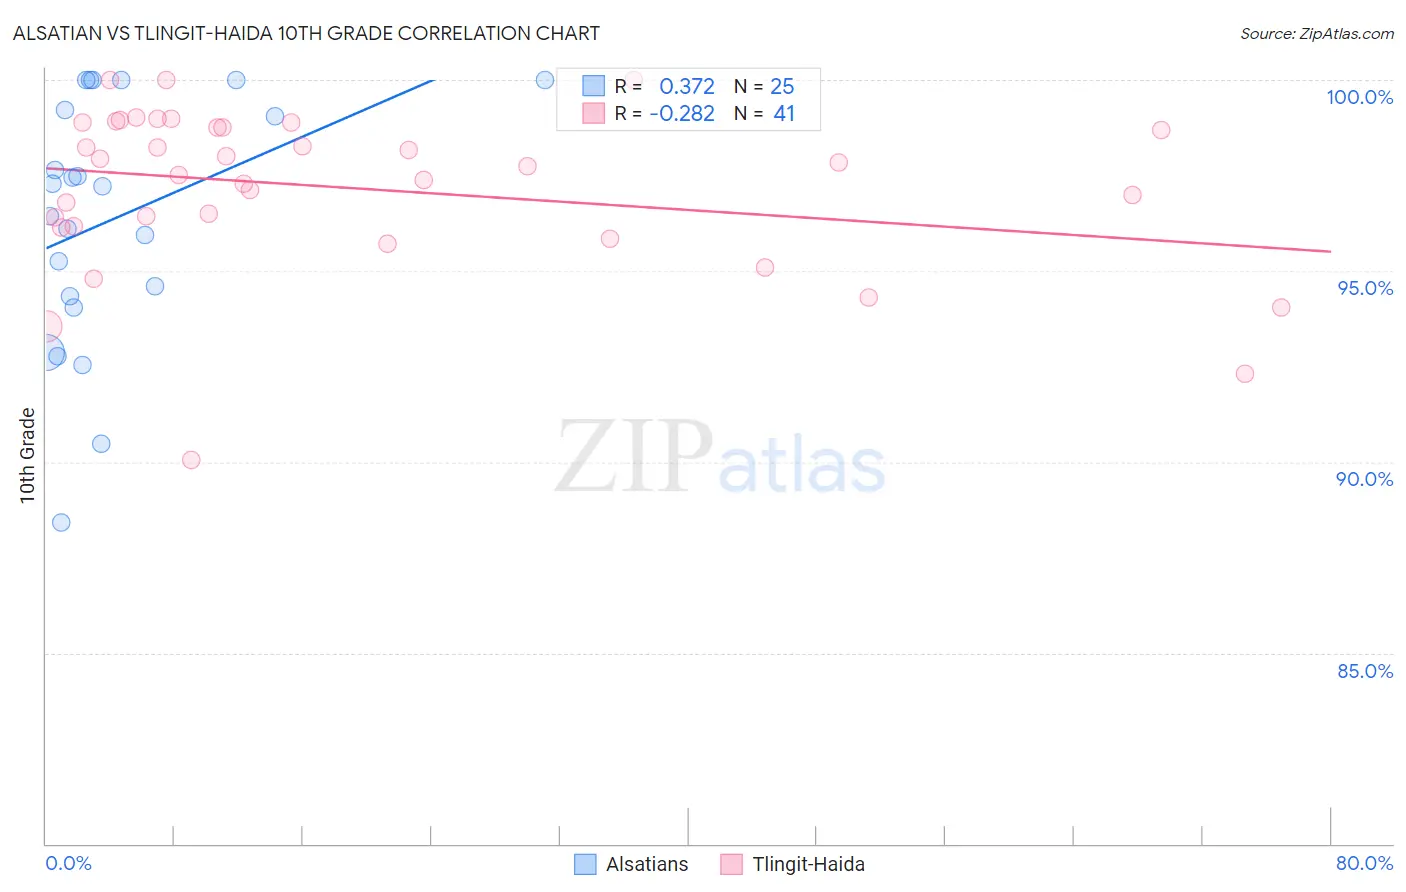
Alsatian vs Tlingit-Haida 10th Grade Correlation Chart
The statistical analysis conducted on geographies consisting of 82,682,365 people shows a mild positive correlation between the proportion of Alsatians and percentage of population with at least 10th grade education in the United States with a correlation coefficient (R) of 0.372 and weighted average of 93.8%. Similarly, the statistical analysis conducted on geographies consisting of 60,871,919 people shows a weak negative correlation between the proportion of Tlingit-Haida and percentage of population with at least 10th grade education in the United States with a correlation coefficient (R) of -0.282 and weighted average of 95.7%, a difference of 2.0%.
10th Grade Correlation Summary
| Measurement | Alsatian | Tlingit-Haida |
| Minimum | 88.4% | 90.1% |
| Maximum | 100.0% | 100.0% |
| Range | 11.6% | 9.9% |
| Mean | 96.4% | 97.2% |
| Median | 97.2% | 97.7% |
| Interquartile 25% (IQ1) | 94.2% | 96.2% |
| Interquartile 75% (IQ3) | 99.6% | 98.8% |
| Interquartile Range (IQR) | 5.4% | 2.7% |
| Standard Deviation (Sample) | 3.2% | 2.1% |
| Standard Deviation (Population) | 3.2% | 2.1% |
Similar Demographics by 10th Grade
Demographics Similar to Alsatians by 10th Grade
In terms of 10th grade, the demographic groups most similar to Alsatians are Immigrants from Iraq (93.8%, a difference of 0.030%), Immigrants from Egypt (93.8%, a difference of 0.030%), Immigrants from Spain (93.8%, a difference of 0.030%), Brazilian (93.8%, a difference of 0.040%), and Immigrants from Venezuela (93.8%, a difference of 0.050%).
| Demographics | Rating | Rank | 10th Grade |
| Assyrians/Chaldeans/Syriacs | 69.7 /100 | #161 | Good 93.9% |
| Immigrants | Poland | 69.6 /100 | #162 | Good 93.9% |
| Venezuelans | 69.5 /100 | #163 | Good 93.9% |
| Iraqis | 68.1 /100 | #164 | Good 93.9% |
| Brazilians | 63.6 /100 | #165 | Good 93.8% |
| Immigrants | Iraq | 63.0 /100 | #166 | Good 93.8% |
| Immigrants | Egypt | 62.3 /100 | #167 | Good 93.8% |
| Alsatians | 59.4 /100 | #168 | Average 93.8% |
| Immigrants | Spain | 55.9 /100 | #169 | Average 93.8% |
| Immigrants | Venezuela | 53.9 /100 | #170 | Average 93.8% |
| Immigrants | Albania | 52.4 /100 | #171 | Average 93.8% |
| French American Indians | 50.9 /100 | #172 | Average 93.7% |
| Spaniards | 50.3 /100 | #173 | Average 93.7% |
| Argentineans | 50.0 /100 | #174 | Average 93.7% |
| Immigrants | Nepal | 49.6 /100 | #175 | Average 93.7% |
Demographics Similar to Tlingit-Haida by 10th Grade
In terms of 10th grade, the demographic groups most similar to Tlingit-Haida are Danish (95.7%, a difference of 0.040%), English (95.6%, a difference of 0.040%), Tsimshian (95.6%, a difference of 0.040%), Irish (95.6%, a difference of 0.060%), and Croatian (95.7%, a difference of 0.080%).
| Demographics | Rating | Rank | 10th Grade |
| Carpatho Rusyns | 100.0 /100 | #5 | Exceptional 95.9% |
| Poles | 100.0 /100 | #6 | Exceptional 95.8% |
| Germans | 100.0 /100 | #7 | Exceptional 95.8% |
| Lithuanians | 100.0 /100 | #8 | Exceptional 95.8% |
| Finns | 100.0 /100 | #9 | Exceptional 95.8% |
| Croatians | 100.0 /100 | #10 | Exceptional 95.7% |
| Danes | 100.0 /100 | #11 | Exceptional 95.7% |
| Tlingit-Haida | 100.0 /100 | #12 | Exceptional 95.7% |
| English | 100.0 /100 | #13 | Exceptional 95.6% |
| Tsimshian | 100.0 /100 | #14 | Exceptional 95.6% |
| Irish | 100.0 /100 | #15 | Exceptional 95.6% |
| Scottish | 100.0 /100 | #16 | Exceptional 95.6% |
| Latvians | 100.0 /100 | #17 | Exceptional 95.6% |
| Italians | 100.0 /100 | #18 | Exceptional 95.6% |
| Scandinavians | 100.0 /100 | #19 | Exceptional 95.6% |