Alsatian vs African 10th Grade
COMPARE
Alsatian
African
10th Grade
10th Grade Comparison
Alsatians
Africans
93.8%
10TH GRADE
59.4/ 100
METRIC RATING
168th/ 347
METRIC RANK
93.1%
10TH GRADE
4.6/ 100
METRIC RATING
235th/ 347
METRIC RANK
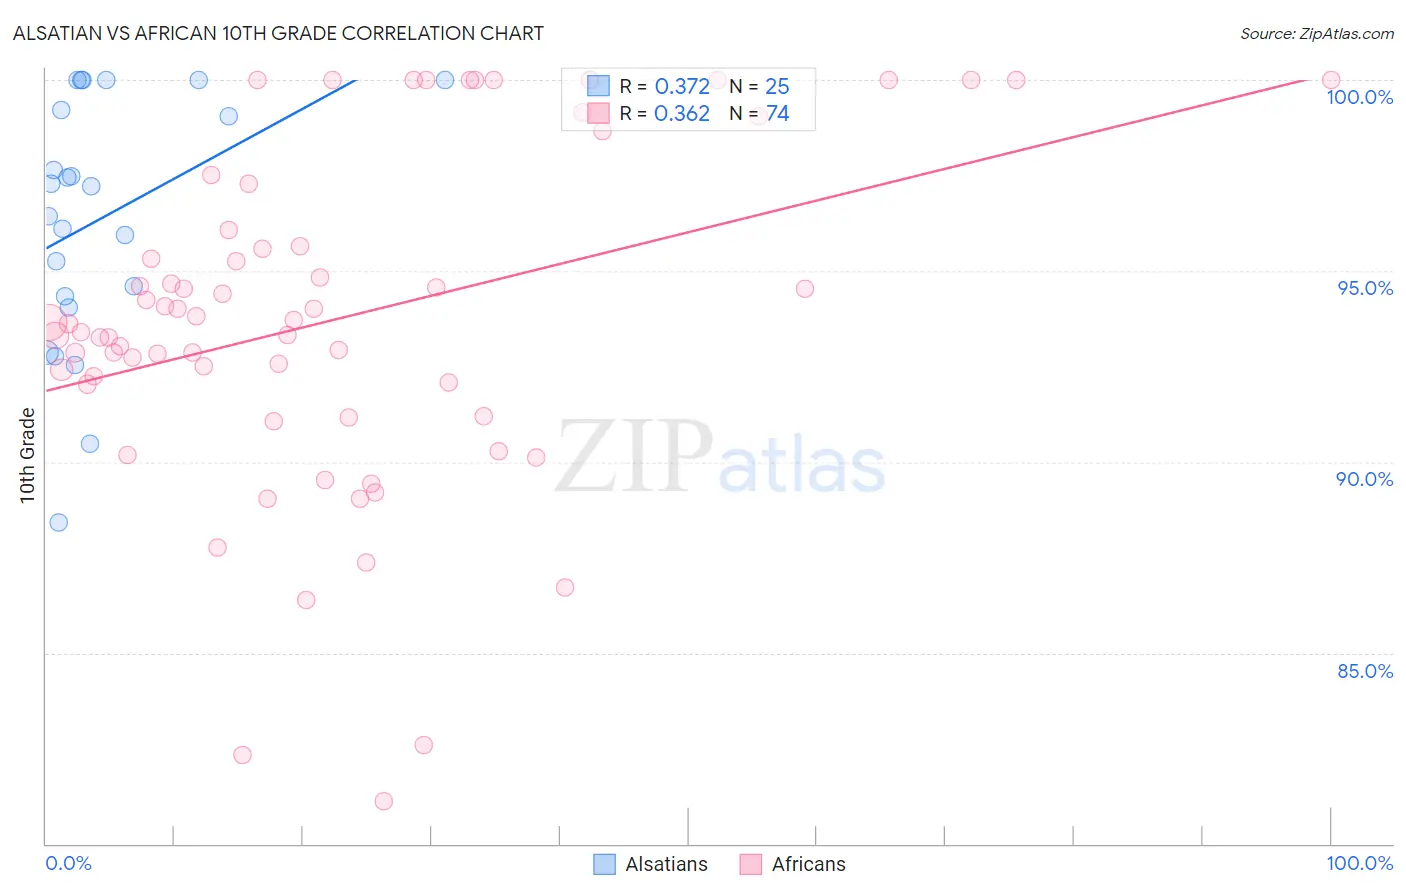
Alsatian vs African 10th Grade Correlation Chart
The statistical analysis conducted on geographies consisting of 82,682,365 people shows a mild positive correlation between the proportion of Alsatians and percentage of population with at least 10th grade education in the United States with a correlation coefficient (R) of 0.372 and weighted average of 93.8%. Similarly, the statistical analysis conducted on geographies consisting of 470,094,658 people shows a mild positive correlation between the proportion of Africans and percentage of population with at least 10th grade education in the United States with a correlation coefficient (R) of 0.362 and weighted average of 93.1%, a difference of 0.77%.
10th Grade Correlation Summary
| Measurement | Alsatian | African |
| Minimum | 88.4% | 81.1% |
| Maximum | 100.0% | 100.0% |
| Range | 11.6% | 18.9% |
| Mean | 96.4% | 93.8% |
| Median | 97.2% | 93.6% |
| Interquartile 25% (IQ1) | 94.2% | 92.0% |
| Interquartile 75% (IQ3) | 99.6% | 96.1% |
| Interquartile Range (IQR) | 5.4% | 4.0% |
| Standard Deviation (Sample) | 3.2% | 4.4% |
| Standard Deviation (Population) | 3.2% | 4.4% |
Similar Demographics by 10th Grade
Demographics Similar to Alsatians by 10th Grade
In terms of 10th grade, the demographic groups most similar to Alsatians are Immigrants from Iraq (93.8%, a difference of 0.030%), Immigrants from Egypt (93.8%, a difference of 0.030%), Immigrants from Spain (93.8%, a difference of 0.030%), Brazilian (93.8%, a difference of 0.040%), and Immigrants from Venezuela (93.8%, a difference of 0.050%).
| Demographics | Rating | Rank | 10th Grade |
| Assyrians/Chaldeans/Syriacs | 69.7 /100 | #161 | Good 93.9% |
| Immigrants | Poland | 69.6 /100 | #162 | Good 93.9% |
| Venezuelans | 69.5 /100 | #163 | Good 93.9% |
| Iraqis | 68.1 /100 | #164 | Good 93.9% |
| Brazilians | 63.6 /100 | #165 | Good 93.8% |
| Immigrants | Iraq | 63.0 /100 | #166 | Good 93.8% |
| Immigrants | Egypt | 62.3 /100 | #167 | Good 93.8% |
| Alsatians | 59.4 /100 | #168 | Average 93.8% |
| Immigrants | Spain | 55.9 /100 | #169 | Average 93.8% |
| Immigrants | Venezuela | 53.9 /100 | #170 | Average 93.8% |
| Immigrants | Albania | 52.4 /100 | #171 | Average 93.8% |
| French American Indians | 50.9 /100 | #172 | Average 93.7% |
| Spaniards | 50.3 /100 | #173 | Average 93.7% |
| Argentineans | 50.0 /100 | #174 | Average 93.7% |
| Immigrants | Nepal | 49.6 /100 | #175 | Average 93.7% |
Demographics Similar to Africans by 10th Grade
In terms of 10th grade, the demographic groups most similar to Africans are Afghan (93.1%, a difference of 0.0%), South American Indian (93.1%, a difference of 0.010%), Bahamian (93.1%, a difference of 0.010%), Comanche (93.1%, a difference of 0.010%), and Subsaharan African (93.1%, a difference of 0.010%).
| Demographics | Rating | Rank | 10th Grade |
| Immigrants | China | 5.9 /100 | #228 | Tragic 93.2% |
| Immigrants | Ethiopia | 5.1 /100 | #229 | Tragic 93.1% |
| Immigrants | Africa | 5.0 /100 | #230 | Tragic 93.1% |
| South American Indians | 4.9 /100 | #231 | Tragic 93.1% |
| Bahamians | 4.9 /100 | #232 | Tragic 93.1% |
| Comanche | 4.9 /100 | #233 | Tragic 93.1% |
| Sub-Saharan Africans | 4.7 /100 | #234 | Tragic 93.1% |
| Africans | 4.6 /100 | #235 | Tragic 93.1% |
| Afghans | 4.5 /100 | #236 | Tragic 93.1% |
| Immigrants | Panama | 4.3 /100 | #237 | Tragic 93.1% |
| Nigerians | 4.2 /100 | #238 | Tragic 93.1% |
| Costa Ricans | 4.2 /100 | #239 | Tragic 93.1% |
| Immigrants | Hong Kong | 4.2 /100 | #240 | Tragic 93.1% |
| Immigrants | Somalia | 2.7 /100 | #241 | Tragic 93.0% |
| Immigrants | Cameroon | 2.6 /100 | #242 | Tragic 93.0% |