Alsatian vs Immigrants from Bolivia 10th Grade
COMPARE
Alsatian
Immigrants from Bolivia
10th Grade
10th Grade Comparison
Alsatians
Immigrants from Bolivia
93.8%
10TH GRADE
59.4/ 100
METRIC RATING
168th/ 347
METRIC RANK
92.7%
10TH GRADE
0.7/ 100
METRIC RATING
255th/ 347
METRIC RANK
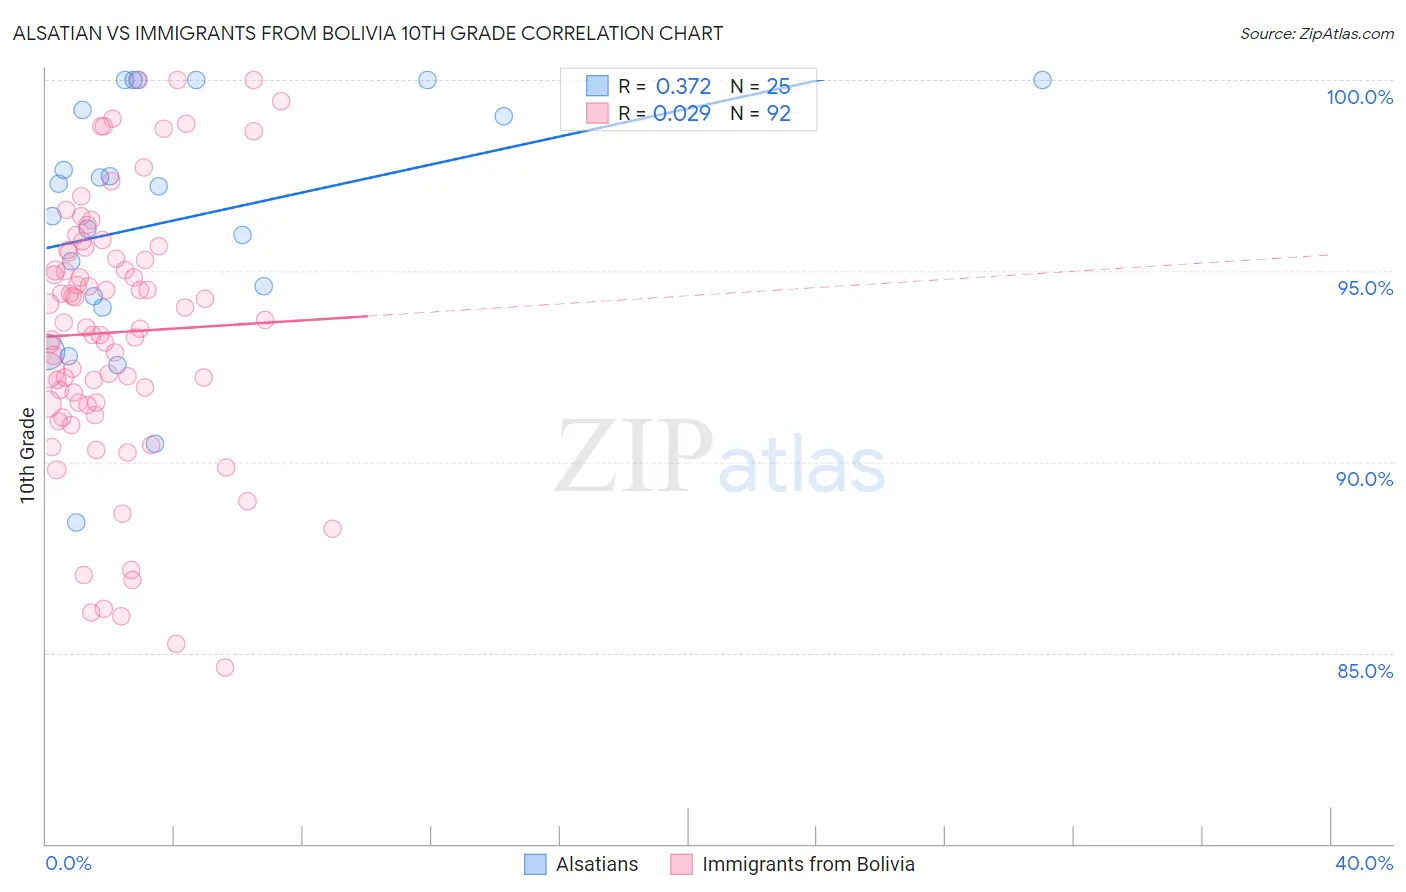
Alsatian vs Immigrants from Bolivia 10th Grade Correlation Chart
The statistical analysis conducted on geographies consisting of 82,682,365 people shows a mild positive correlation between the proportion of Alsatians and percentage of population with at least 10th grade education in the United States with a correlation coefficient (R) of 0.372 and weighted average of 93.8%. Similarly, the statistical analysis conducted on geographies consisting of 158,717,902 people shows no correlation between the proportion of Immigrants from Bolivia and percentage of population with at least 10th grade education in the United States with a correlation coefficient (R) of 0.029 and weighted average of 92.7%, a difference of 1.2%.
10th Grade Correlation Summary
| Measurement | Alsatian | Immigrants from Bolivia |
| Minimum | 88.4% | 84.6% |
| Maximum | 100.0% | 100.0% |
| Range | 11.6% | 15.4% |
| Mean | 96.4% | 93.4% |
| Median | 97.2% | 93.6% |
| Interquartile 25% (IQ1) | 94.2% | 91.5% |
| Interquartile 75% (IQ3) | 99.6% | 95.5% |
| Interquartile Range (IQR) | 5.4% | 4.0% |
| Standard Deviation (Sample) | 3.2% | 3.5% |
| Standard Deviation (Population) | 3.2% | 3.5% |
Similar Demographics by 10th Grade
Demographics Similar to Alsatians by 10th Grade
In terms of 10th grade, the demographic groups most similar to Alsatians are Immigrants from Iraq (93.8%, a difference of 0.030%), Immigrants from Egypt (93.8%, a difference of 0.030%), Immigrants from Spain (93.8%, a difference of 0.030%), Brazilian (93.8%, a difference of 0.040%), and Immigrants from Venezuela (93.8%, a difference of 0.050%).
| Demographics | Rating | Rank | 10th Grade |
| Assyrians/Chaldeans/Syriacs | 69.7 /100 | #161 | Good 93.9% |
| Immigrants | Poland | 69.6 /100 | #162 | Good 93.9% |
| Venezuelans | 69.5 /100 | #163 | Good 93.9% |
| Iraqis | 68.1 /100 | #164 | Good 93.9% |
| Brazilians | 63.6 /100 | #165 | Good 93.8% |
| Immigrants | Iraq | 63.0 /100 | #166 | Good 93.8% |
| Immigrants | Egypt | 62.3 /100 | #167 | Good 93.8% |
| Alsatians | 59.4 /100 | #168 | Average 93.8% |
| Immigrants | Spain | 55.9 /100 | #169 | Average 93.8% |
| Immigrants | Venezuela | 53.9 /100 | #170 | Average 93.8% |
| Immigrants | Albania | 52.4 /100 | #171 | Average 93.8% |
| French American Indians | 50.9 /100 | #172 | Average 93.7% |
| Spaniards | 50.3 /100 | #173 | Average 93.7% |
| Argentineans | 50.0 /100 | #174 | Average 93.7% |
| Immigrants | Nepal | 49.6 /100 | #175 | Average 93.7% |
Demographics Similar to Immigrants from Bolivia by 10th Grade
In terms of 10th grade, the demographic groups most similar to Immigrants from Bolivia are Immigrants from Nigeria (92.7%, a difference of 0.010%), U.S. Virgin Islander (92.7%, a difference of 0.020%), Immigrants from Costa Rica (92.7%, a difference of 0.030%), Armenian (92.7%, a difference of 0.050%), and South American (92.8%, a difference of 0.060%).
| Demographics | Rating | Rank | 10th Grade |
| Colombians | 1.4 /100 | #248 | Tragic 92.8% |
| Immigrants | Senegal | 1.4 /100 | #249 | Tragic 92.8% |
| Jamaicans | 1.2 /100 | #250 | Tragic 92.8% |
| Immigrants | Thailand | 1.0 /100 | #251 | Tragic 92.8% |
| South Americans | 0.9 /100 | #252 | Tragic 92.8% |
| Ghanaians | 0.9 /100 | #253 | Tragic 92.8% |
| Armenians | 0.9 /100 | #254 | Tragic 92.7% |
| Immigrants | Bolivia | 0.7 /100 | #255 | Tragic 92.7% |
| Immigrants | Nigeria | 0.7 /100 | #256 | Tragic 92.7% |
| U.S. Virgin Islanders | 0.7 /100 | #257 | Tragic 92.7% |
| Immigrants | Costa Rica | 0.6 /100 | #258 | Tragic 92.7% |
| Immigrants | Jamaica | 0.5 /100 | #259 | Tragic 92.6% |
| Immigrants | Uzbekistan | 0.5 /100 | #260 | Tragic 92.6% |
| Paiute | 0.4 /100 | #261 | Tragic 92.6% |
| Immigrants | South America | 0.4 /100 | #262 | Tragic 92.6% |