Native/Alaskan vs Immigrants from Jordan 10th Grade
COMPARE
Native/Alaskan
Immigrants from Jordan
10th Grade
10th Grade Comparison
Natives/Alaskans
Immigrants from Jordan
92.2%
10TH GRADE
0.1/ 100
METRIC RATING
279th/ 347
METRIC RANK
94.1%
10TH GRADE
87.6/ 100
METRIC RATING
140th/ 347
METRIC RANK
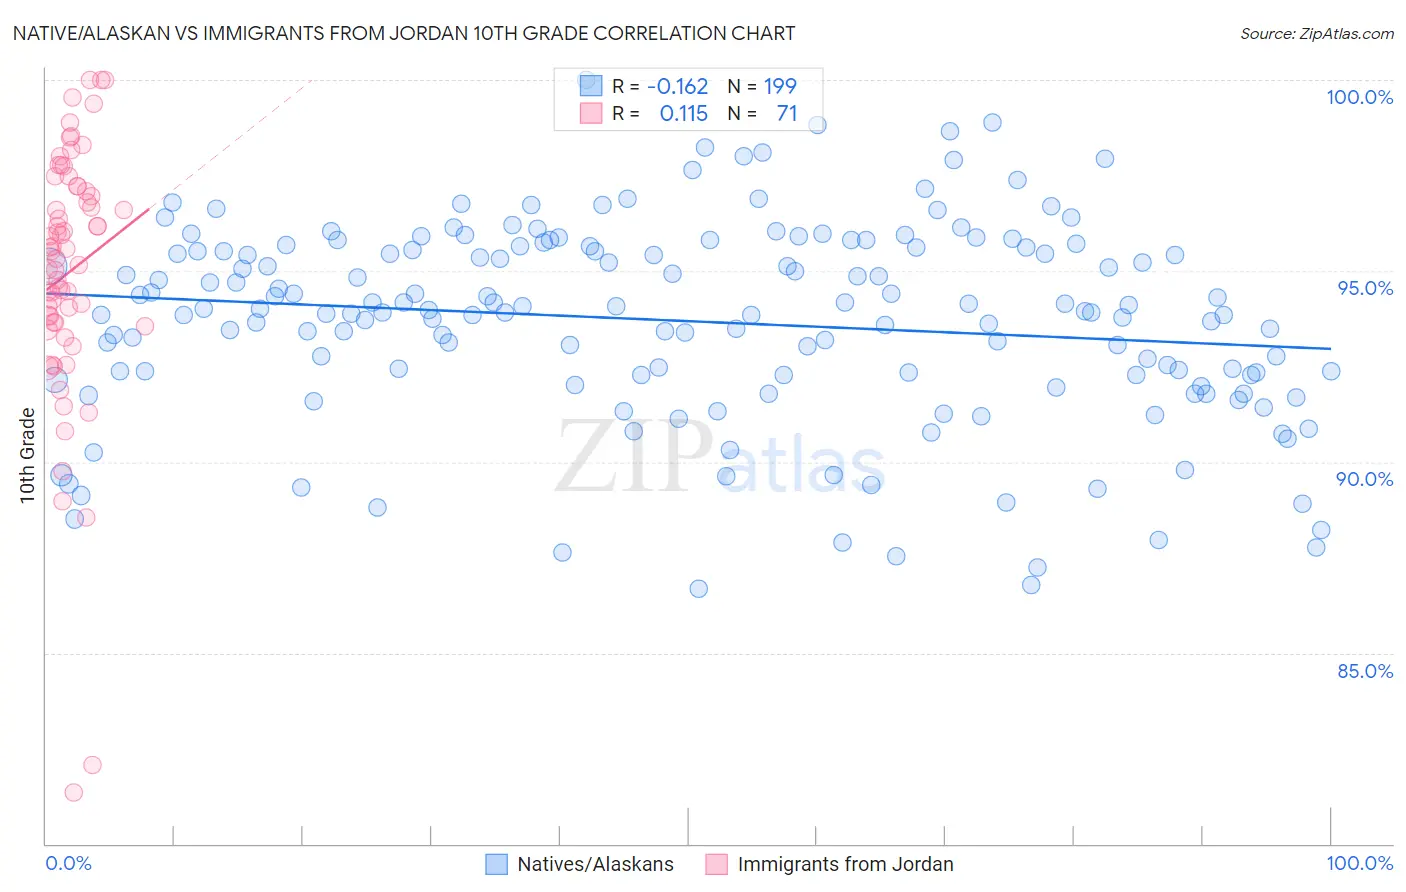
Native/Alaskan vs Immigrants from Jordan 10th Grade Correlation Chart
The statistical analysis conducted on geographies consisting of 513,060,394 people shows a poor negative correlation between the proportion of Natives/Alaskans and percentage of population with at least 10th grade education in the United States with a correlation coefficient (R) of -0.162 and weighted average of 92.2%. Similarly, the statistical analysis conducted on geographies consisting of 181,278,272 people shows a poor positive correlation between the proportion of Immigrants from Jordan and percentage of population with at least 10th grade education in the United States with a correlation coefficient (R) of 0.115 and weighted average of 94.1%, a difference of 2.1%.
10th Grade Correlation Summary
| Measurement | Native/Alaskan | Immigrants from Jordan |
| Minimum | 86.7% | 81.3% |
| Maximum | 100.0% | 100.0% |
| Range | 13.3% | 18.7% |
| Mean | 93.7% | 95.0% |
| Median | 93.9% | 95.5% |
| Interquartile 25% (IQ1) | 92.3% | 93.6% |
| Interquartile 75% (IQ3) | 95.6% | 97.2% |
| Interquartile Range (IQR) | 3.3% | 3.6% |
| Standard Deviation (Sample) | 2.6% | 3.4% |
| Standard Deviation (Population) | 2.6% | 3.4% |
Similar Demographics by 10th Grade
Demographics Similar to Natives/Alaskans by 10th Grade
In terms of 10th grade, the demographic groups most similar to Natives/Alaskans are Barbadian (92.2%, a difference of 0.010%), Malaysian (92.2%, a difference of 0.030%), Navajo (92.3%, a difference of 0.040%), Bangladeshi (92.2%, a difference of 0.040%), and Immigrants from Peru (92.2%, a difference of 0.060%).
| Demographics | Rating | Rank | 10th Grade |
| Immigrants | Western Africa | 0.3 /100 | #272 | Tragic 92.5% |
| Trinidadians and Tobagonians | 0.2 /100 | #273 | Tragic 92.4% |
| Immigrants | Congo | 0.2 /100 | #274 | Tragic 92.4% |
| West Indians | 0.2 /100 | #275 | Tragic 92.4% |
| Immigrants | Trinidad and Tobago | 0.1 /100 | #276 | Tragic 92.3% |
| Navajo | 0.1 /100 | #277 | Tragic 92.3% |
| Barbadians | 0.1 /100 | #278 | Tragic 92.2% |
| Natives/Alaskans | 0.1 /100 | #279 | Tragic 92.2% |
| Malaysians | 0.1 /100 | #280 | Tragic 92.2% |
| Bangladeshis | 0.1 /100 | #281 | Tragic 92.2% |
| Immigrants | Peru | 0.1 /100 | #282 | Tragic 92.2% |
| Immigrants | St. Vincent and the Grenadines | 0.0 /100 | #283 | Tragic 92.1% |
| Immigrants | Barbados | 0.0 /100 | #284 | Tragic 92.1% |
| Immigrants | South Eastern Asia | 0.0 /100 | #285 | Tragic 92.1% |
| Yuman | 0.0 /100 | #286 | Tragic 92.0% |
Demographics Similar to Immigrants from Jordan by 10th Grade
In terms of 10th grade, the demographic groups most similar to Immigrants from Jordan are Hmong (94.1%, a difference of 0.020%), Albanian (94.1%, a difference of 0.020%), Immigrants from Bosnia and Herzegovina (94.2%, a difference of 0.040%), Immigrants from Sri Lanka (94.2%, a difference of 0.050%), and Cherokee (94.1%, a difference of 0.050%).
| Demographics | Rating | Rank | 10th Grade |
| Creek | 91.9 /100 | #133 | Exceptional 94.2% |
| Osage | 91.7 /100 | #134 | Exceptional 94.2% |
| Immigrants | Korea | 91.3 /100 | #135 | Exceptional 94.2% |
| Shoshone | 90.8 /100 | #136 | Exceptional 94.2% |
| Arapaho | 90.5 /100 | #137 | Exceptional 94.2% |
| Immigrants | Sri Lanka | 89.9 /100 | #138 | Excellent 94.2% |
| Immigrants | Bosnia and Herzegovina | 89.4 /100 | #139 | Excellent 94.2% |
| Immigrants | Jordan | 87.6 /100 | #140 | Excellent 94.1% |
| Hmong | 86.6 /100 | #141 | Excellent 94.1% |
| Albanians | 86.5 /100 | #142 | Excellent 94.1% |
| Cherokee | 84.9 /100 | #143 | Excellent 94.1% |
| Immigrants | Kazakhstan | 84.9 /100 | #144 | Excellent 94.1% |
| Immigrants | Nonimmigrants | 83.8 /100 | #145 | Excellent 94.1% |
| Chickasaw | 82.6 /100 | #146 | Excellent 94.1% |
| Immigrants | Ukraine | 81.5 /100 | #147 | Excellent 94.0% |