Alsatian vs Immigrants from Cambodia 10th Grade
COMPARE
Alsatian
Immigrants from Cambodia
10th Grade
10th Grade Comparison
Alsatians
Immigrants from Cambodia
93.8%
10TH GRADE
59.4/ 100
METRIC RATING
168th/ 347
METRIC RANK
90.9%
10TH GRADE
0.0/ 100
METRIC RATING
311th/ 347
METRIC RANK
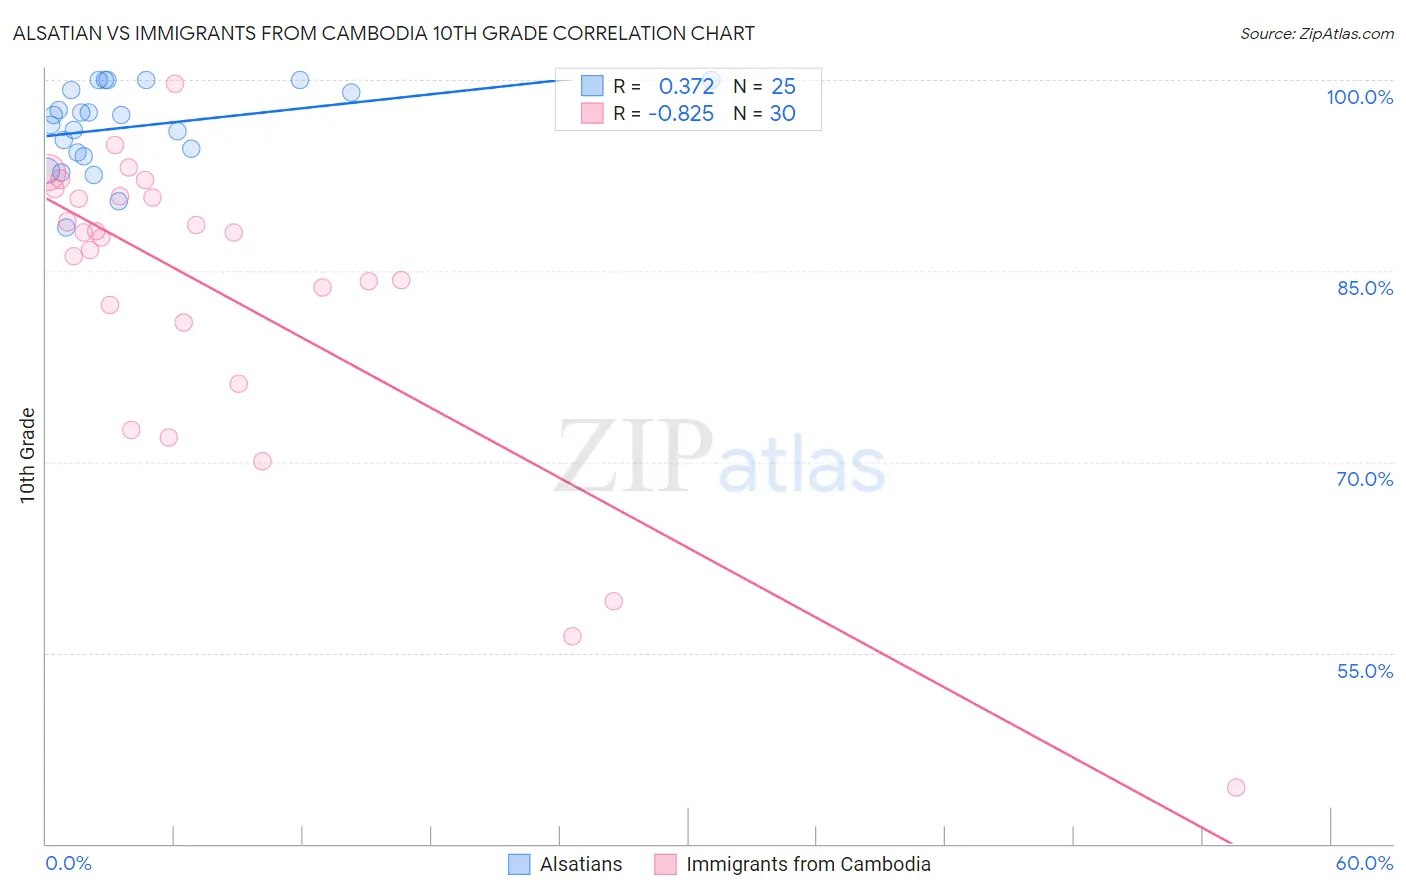
Alsatian vs Immigrants from Cambodia 10th Grade Correlation Chart
The statistical analysis conducted on geographies consisting of 82,682,365 people shows a mild positive correlation between the proportion of Alsatians and percentage of population with at least 10th grade education in the United States with a correlation coefficient (R) of 0.372 and weighted average of 93.8%. Similarly, the statistical analysis conducted on geographies consisting of 205,153,442 people shows a very strong negative correlation between the proportion of Immigrants from Cambodia and percentage of population with at least 10th grade education in the United States with a correlation coefficient (R) of -0.825 and weighted average of 90.9%, a difference of 3.2%.
10th Grade Correlation Summary
| Measurement | Alsatian | Immigrants from Cambodia |
| Minimum | 88.4% | 44.4% |
| Maximum | 100.0% | 99.7% |
| Range | 11.6% | 55.2% |
| Mean | 96.4% | 83.2% |
| Median | 97.2% | 87.8% |
| Interquartile 25% (IQ1) | 94.2% | 80.9% |
| Interquartile 75% (IQ3) | 99.6% | 90.8% |
| Interquartile Range (IQR) | 5.4% | 9.9% |
| Standard Deviation (Sample) | 3.2% | 12.4% |
| Standard Deviation (Population) | 3.2% | 12.2% |
Similar Demographics by 10th Grade
Demographics Similar to Alsatians by 10th Grade
In terms of 10th grade, the demographic groups most similar to Alsatians are Immigrants from Iraq (93.8%, a difference of 0.030%), Immigrants from Egypt (93.8%, a difference of 0.030%), Immigrants from Spain (93.8%, a difference of 0.030%), Brazilian (93.8%, a difference of 0.040%), and Immigrants from Venezuela (93.8%, a difference of 0.050%).
| Demographics | Rating | Rank | 10th Grade |
| Assyrians/Chaldeans/Syriacs | 69.7 /100 | #161 | Good 93.9% |
| Immigrants | Poland | 69.6 /100 | #162 | Good 93.9% |
| Venezuelans | 69.5 /100 | #163 | Good 93.9% |
| Iraqis | 68.1 /100 | #164 | Good 93.9% |
| Brazilians | 63.6 /100 | #165 | Good 93.8% |
| Immigrants | Iraq | 63.0 /100 | #166 | Good 93.8% |
| Immigrants | Egypt | 62.3 /100 | #167 | Good 93.8% |
| Alsatians | 59.4 /100 | #168 | Average 93.8% |
| Immigrants | Spain | 55.9 /100 | #169 | Average 93.8% |
| Immigrants | Venezuela | 53.9 /100 | #170 | Average 93.8% |
| Immigrants | Albania | 52.4 /100 | #171 | Average 93.8% |
| French American Indians | 50.9 /100 | #172 | Average 93.7% |
| Spaniards | 50.3 /100 | #173 | Average 93.7% |
| Argentineans | 50.0 /100 | #174 | Average 93.7% |
| Immigrants | Nepal | 49.6 /100 | #175 | Average 93.7% |
Demographics Similar to Immigrants from Cambodia by 10th Grade
In terms of 10th grade, the demographic groups most similar to Immigrants from Cambodia are Vietnamese (90.9%, a difference of 0.020%), Immigrants (91.0%, a difference of 0.060%), Immigrants from Bangladesh (91.0%, a difference of 0.10%), Immigrants from Fiji (91.0%, a difference of 0.11%), and Immigrants from Portugal (90.8%, a difference of 0.16%).
| Demographics | Rating | Rank | 10th Grade |
| Pima | 0.0 /100 | #304 | Tragic 91.2% |
| Immigrants | Dominica | 0.0 /100 | #305 | Tragic 91.1% |
| Yaqui | 0.0 /100 | #306 | Tragic 91.1% |
| Immigrants | Fiji | 0.0 /100 | #307 | Tragic 91.0% |
| Immigrants | Bangladesh | 0.0 /100 | #308 | Tragic 91.0% |
| Immigrants | Immigrants | 0.0 /100 | #309 | Tragic 91.0% |
| Vietnamese | 0.0 /100 | #310 | Tragic 90.9% |
| Immigrants | Cambodia | 0.0 /100 | #311 | Tragic 90.9% |
| Immigrants | Portugal | 0.0 /100 | #312 | Tragic 90.8% |
| Cape Verdeans | 0.0 /100 | #313 | Tragic 90.8% |
| Nepalese | 0.0 /100 | #314 | Tragic 90.7% |
| Immigrants | Caribbean | 0.0 /100 | #315 | Tragic 90.6% |
| Ecuadorians | 0.0 /100 | #316 | Tragic 90.6% |
| Immigrants | Ecuador | 0.0 /100 | #317 | Tragic 90.4% |
| Immigrants | Cuba | 0.0 /100 | #318 | Tragic 90.2% |